Interest rates continue to decline, DSCR demand remains elevated, and traditional short-term bridge loan volume is uninspiring. With the first month of 2026 complete, January largely extended the momentum that closed out 2025. Notably, DSCR loans accounted for more than 58% of all loans created on Lightning Docs in January.
As rates ease and pricing spreads tighten, the market is entering a more competitive phase. Growth is no longer driven by product adoption alone, but by how lenders differentiate through execution, whether by expanding into new markets, closing faster, strengthening relationships, or removing friction from the lending process. January’s data provides an early signal of how lenders are adjusting to that shift.
Bridge Loan Volume
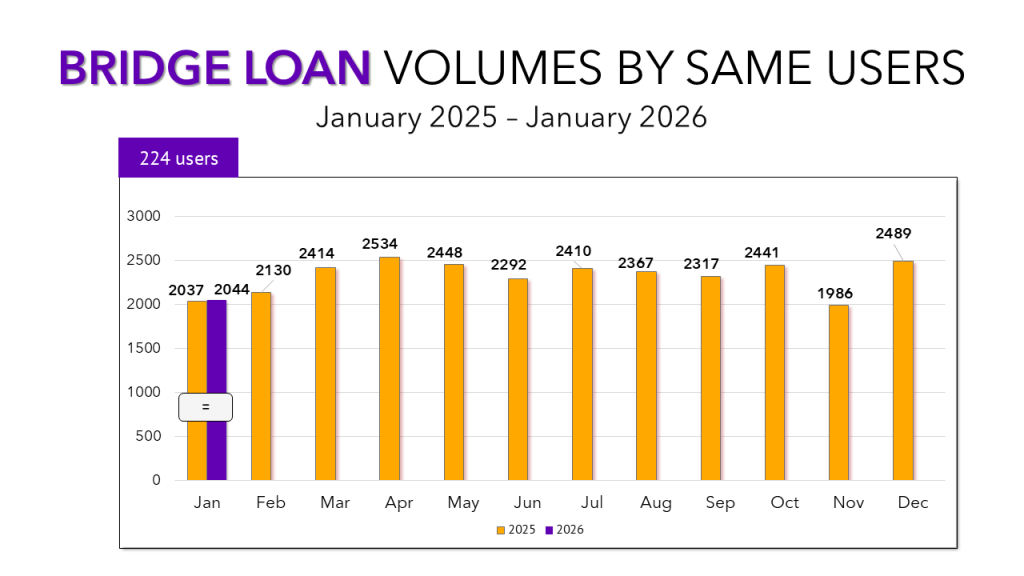
With the start of a new year, we are now evaluating a cohort of users active on Lightning Docs since the beginning of 2025. Among that group, 224 lenders have used the platform to create bridge loan documents. In January 2026 they produced 2044 loans a volume nearly identical to January 2025 levels in which they produced 2037 loans.
This marks the second time in the past three months that bridge lending has shown minimal year-over-year growth. The last time this occurred, the category rebounded the following month. Whether February follows a similar pattern will be an important signal to watch.
One note of caution here is that January 2026 had one less business day than January 2025 which may account for some of the lackluster performance. However, by comparison, when comparing same-store-sales in January 2024 and January 2025, users had generated almost a 70% increase in those two years. What that is telling us is that the start of 2026 is quite different than 2025.
Bridge Loan Interest Rates and Loan Amounts
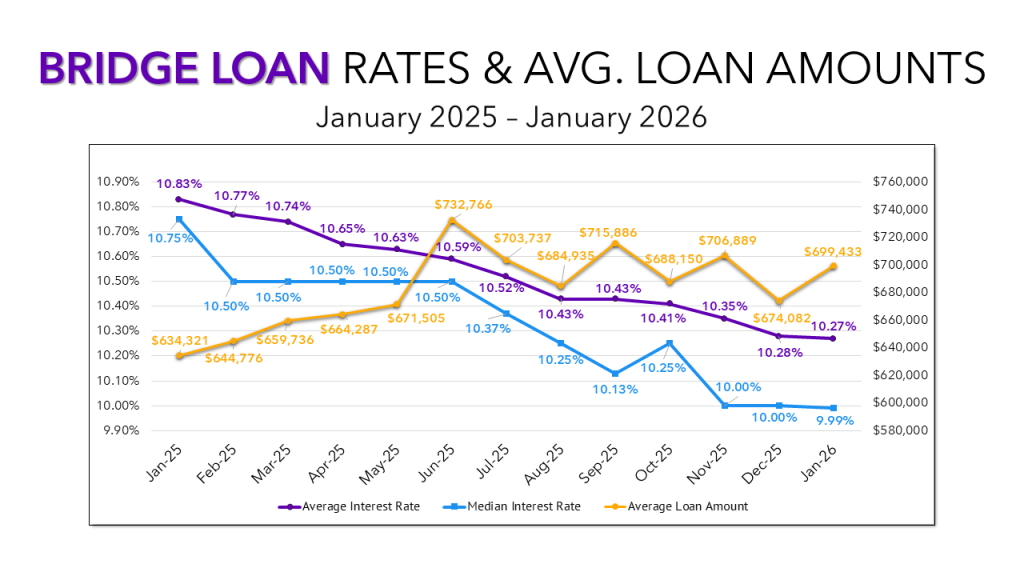
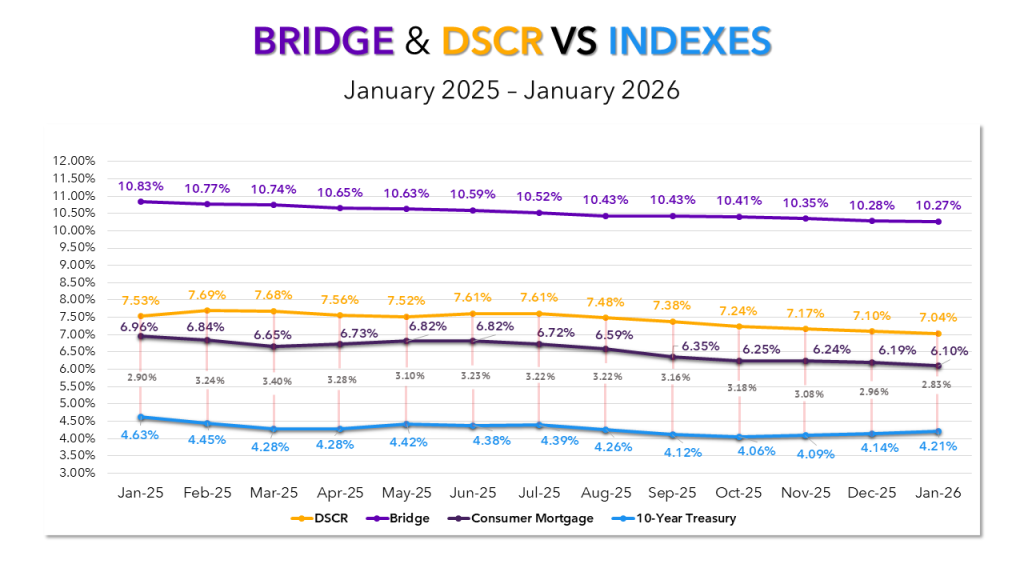
Bridge loan interest rates declined to 10.27% to start the year. The median rate also moved lower, reaching 9.99%, the first time median bridge rates have fallen below 10% since July 2022. Meanwhile, the average bridge loan amount increased by approximately $25,000, bringing the average loan size to just under $700,000. Therefore a perfect storm is brewing in which the competition is rising through lower interest rates even though loan volumes are not picking up.
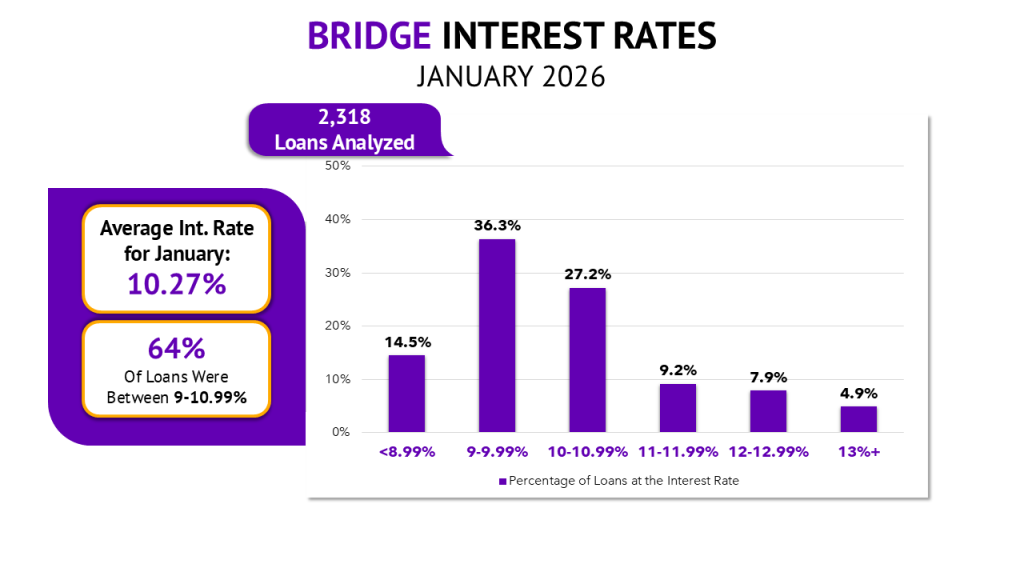
The shift in the distribution of bridge loan interest rates is even more telling. In January, more than 50% of bridge loans carried rates below 10%, and nearly 15% fell below 9%.
A year ago, the landscape looked very different. In January 2025, just 27% of bridge loans were priced below 10%, and only 4.4% fell under 9%. The contrast underscores how materially pricing conditions have shifted over the past twelve months.
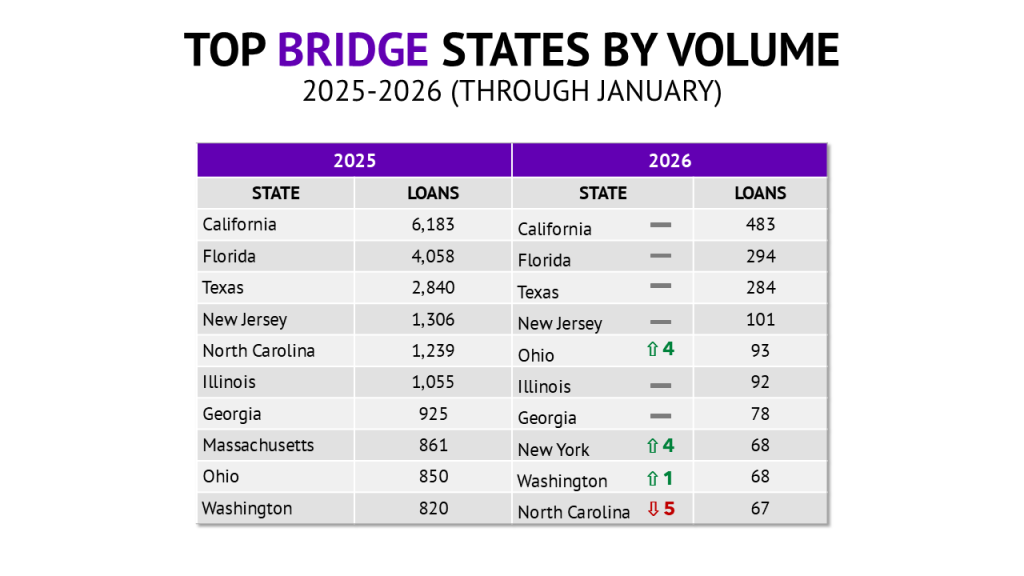
Bridge Loan States
With just one month of data, some variance among the top markets is expected, yet six of the top seven states remain unchanged so far. Ohio and New York both started the year strong, each rising four spots, while North Carolina had a disappointing January, dropping five.
Importantly, these shifts are not driven by one-month outliers. North Carolina closed out 2025 with two consecutive months below 100 bridge loans and declined further in January. Ohio, by contrast, posted its strongest month of 2025 in December with 129 bridge loans and has carried that momentum into the new year. New York has also been trending upward since mid-2025, reinforcing its continued rise in early rankings.
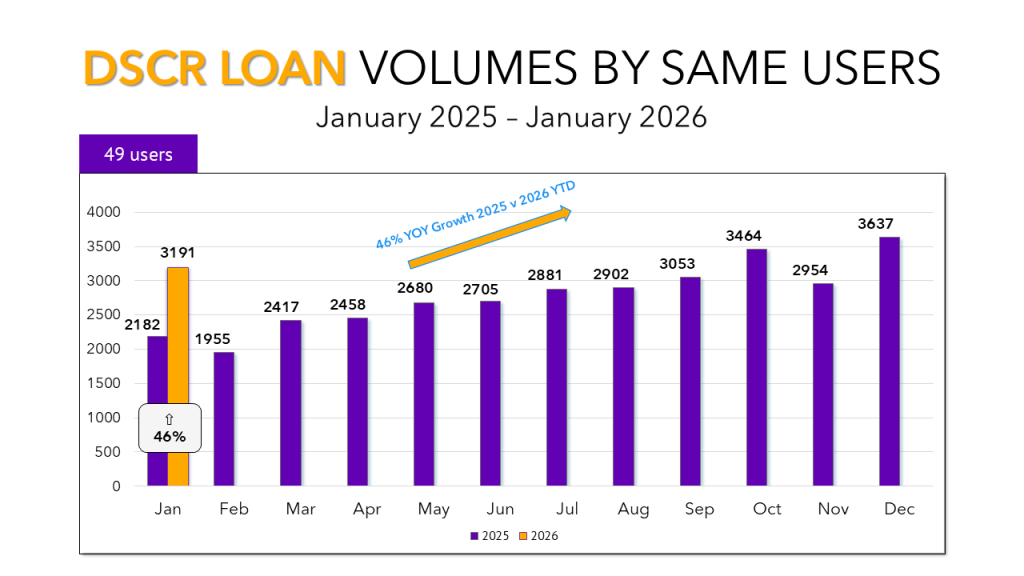
DSCR Loan Volume
DSCR lending remained strong nationwide. While January did not reach the peak levels observed last October or November, it still represented the third-highest month on record and delivered 46% year-over-year growth.
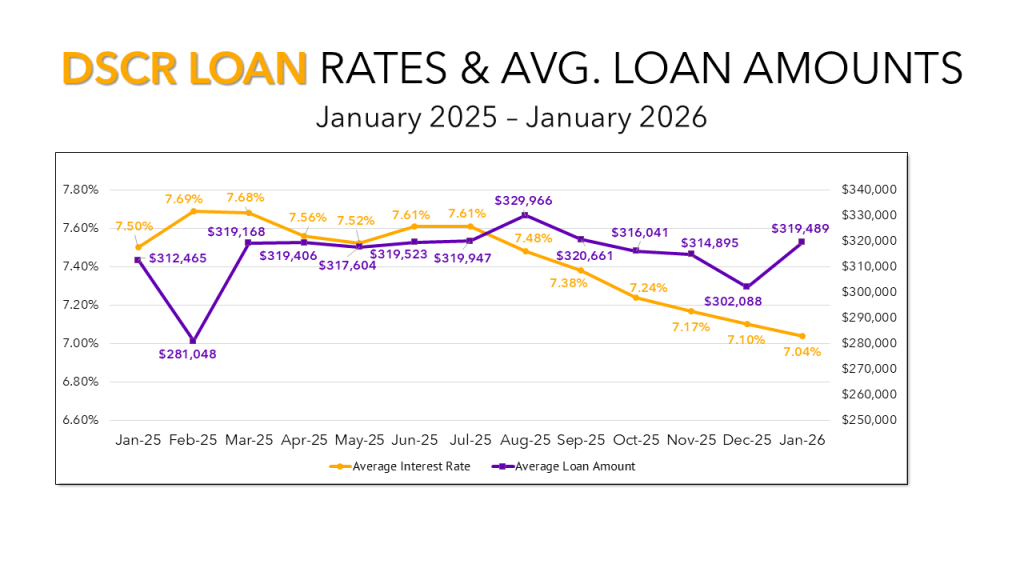
DSCR Interest Rates and Loan Amounts
DSCR interest rates continued their descent in January, averaging at 7.04%. Average loan amounts increased by $17,000, reaching just over $319,000.
The $320,000 mark is a level DSCR loans have approached repeatedly over the past year, but meaningfully exceeded only once, in August 2025. It will be worth watching whether loan sizes push past that threshold in the coming months or if $320,000 continues to act as a ceiling, as it has in recent months.
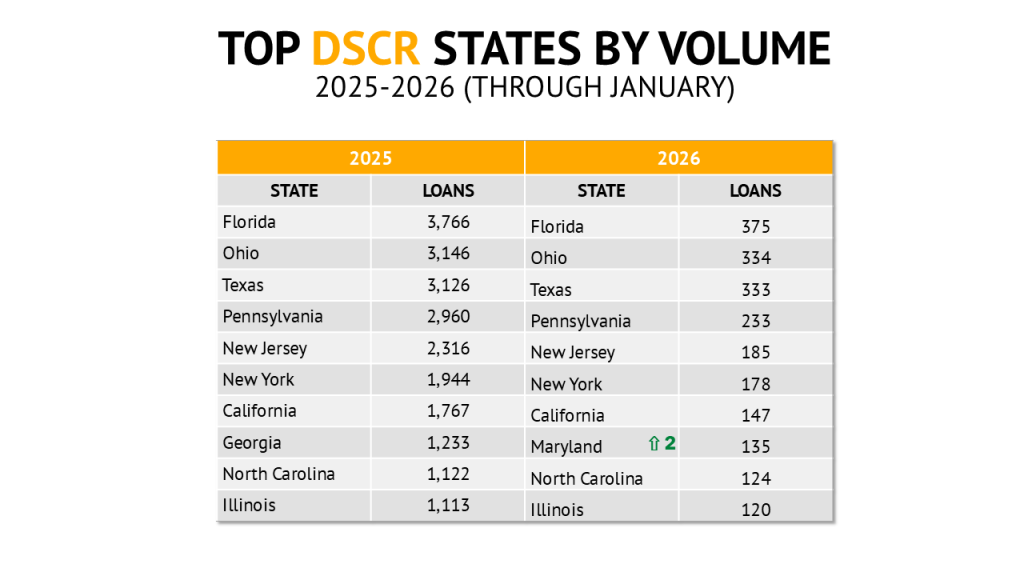
DSCR States
DSCR markets remained notably stable to begin the year. Nine of the top ten states retained their exact ranking positions as 2025. The only change involved Georgia and Maryland swapping places between 8th and 12th. For Georgia, the movement appears to be a short-term fluctuation following a consistently strong 2025 and a particularly strong December. Maryland’s rise may prove more durable, as the state finished last year with solid momentum that continued into January.
Bridge vs DSCR vs Indexes
As in December, bridge, DSCR, and consumer mortgage rates all declined in January. At the same time, the 10-year Treasury increased for the third consecutive month, tightening the spread between Treasury yields and DSCR rates to 2.83%, the lowest we have tracked.
This tightening spread points to both continued strong demand for DSCR loans and a market where lenders can no longer rely on pricing alone to differentiate. As margins compress, competitive advantage is increasingly coming from execution, speed, and certainty of close rather than rate.
Market Spotlight: Bexar County, Texas
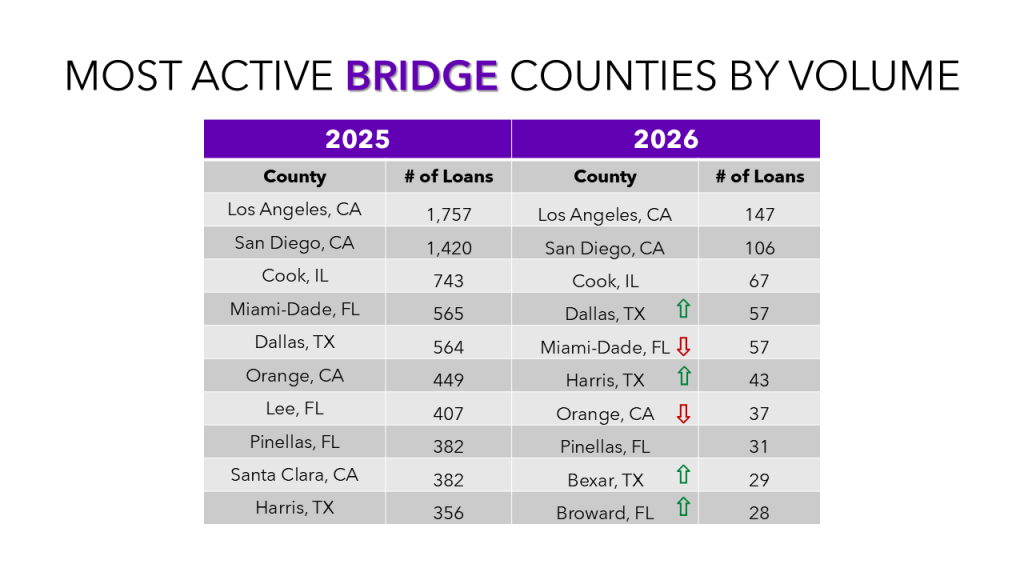
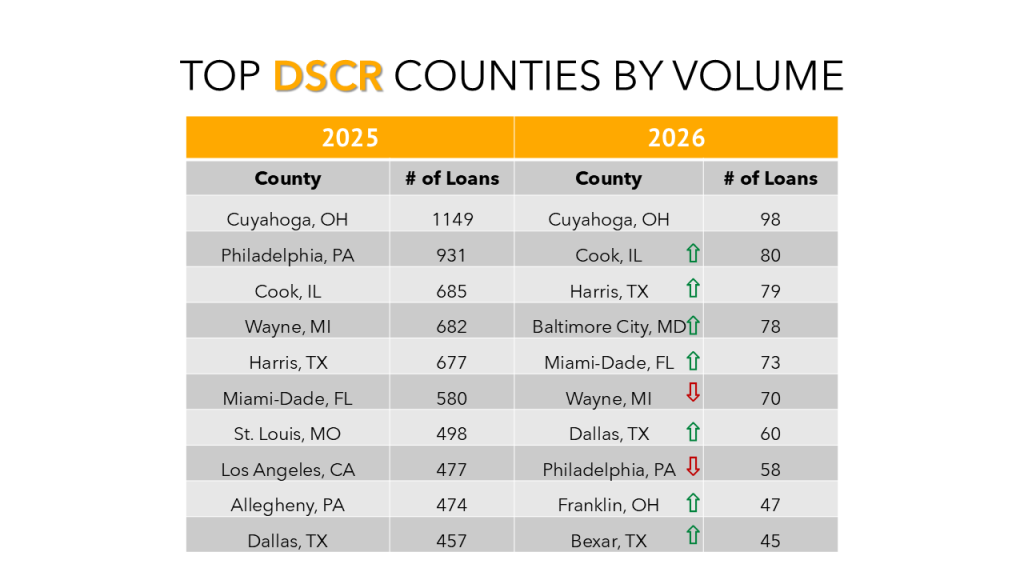
Bexar County, home to San Antonio, has emerged as one of the most compelling markets to start the year. In 2025, Bexar ranked 15th in bridge lending and 20th in DSCR lending. So far in 2026, it has climbed into the top 10 for both categories, ranking 9th in bridge loans and 10th in DSCR loans.
With this rise in activity, Bexar County joins Cook County, IL; Dallas County, TX; Miami-Dade County, FL; and Harris County, TX as markets appearing in the top 10 for both bridge and DSCR lending. Texas now accounts for three of these dual top-10 markets, reinforcing the state’s continued prominence in private lending activity.
Conclusion
January’s data suggests the private lending market is entering a more challenging phase. DSCR lending continues to anchor activity nationwide, but tightening spreads and increasingly stable market rankings indicate that pricing alone is becoming a weaker source of differentiation.
As rates continue to trend lower, lenders looking to gain share will need to focus on how they operate rather than what they offer. Expanding thoughtfully into new markets, closing with greater speed and certainty, and building durable borrower and broker relationships are becoming critical advantages.
Looking ahead, the most meaningful indicators may not come from month-to-month rate changes, but from how lenders deploy capital, streamline operations, and position themselves in a market where efficiency and execution matter more than ever.