
How Much Did Bridge Loan Volume Grow in June?
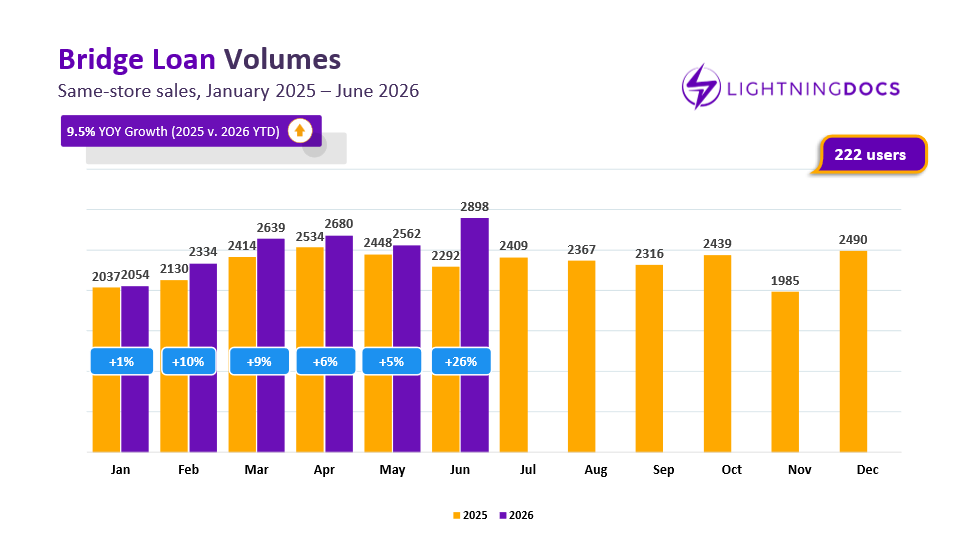
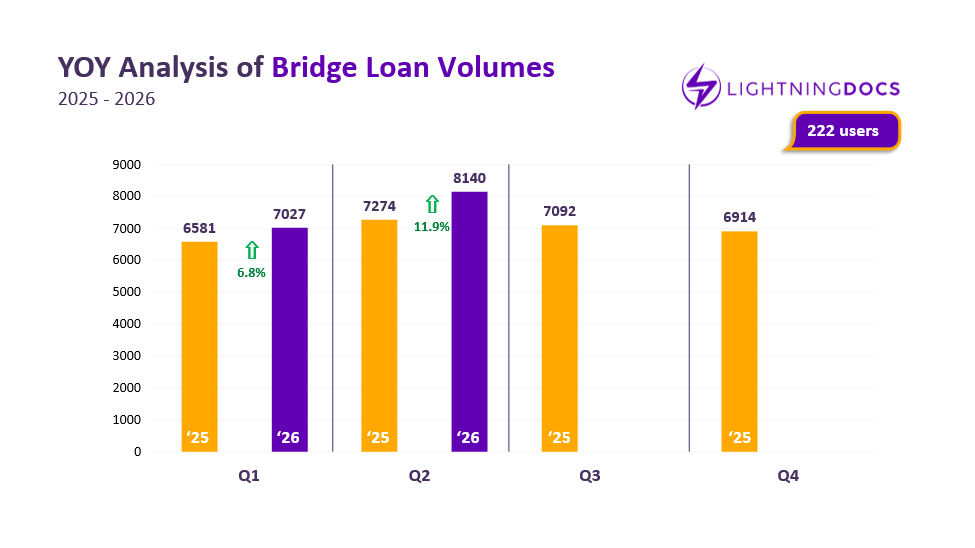
Bridge loan volume hit a new monthly record in June, with 26% year-over-year growth among a consistent cohort of 222 users tracked since the start of 2025. That growth follows a period of stagnation: bridge lending volume had flattened out at the end of 2025 and into early 2026, then showed only modest year-over-year gains through May. June’s 2,898 loans represent the strongest single month this cohort has produced, suggesting that its earlier slowdown may have been a temporary plateau rather than a lasting contraction.
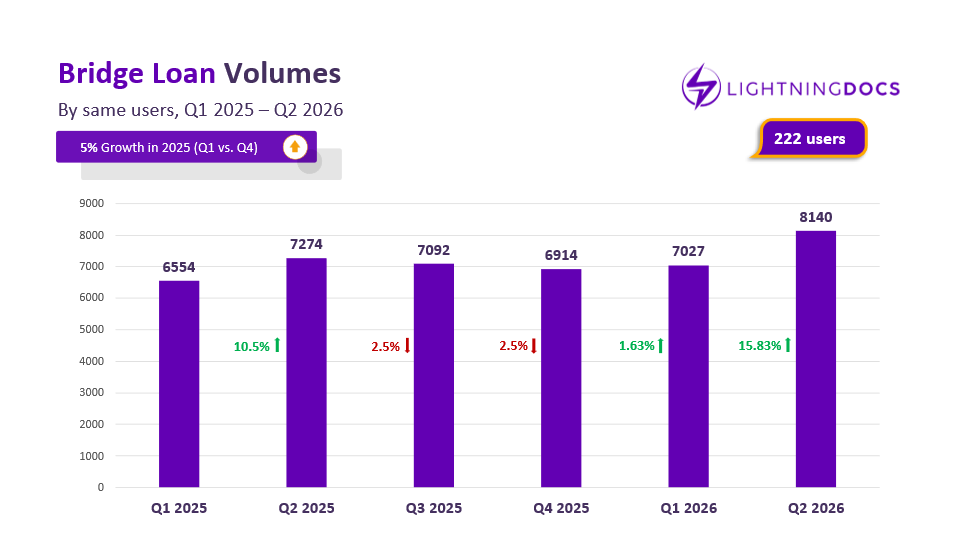
Looking at bridge loan transactions on a quarterly basis, the trend is even more encouraging. Among the same lenders we tracked, bridge loan volume declined for two consecutive quarters in 2025. That trend reversed in Q1 2026 with a modest 1.63% year-over-year increase, and accelerated in Q2 with 15.8% growth, the strongest quarterly increase we’ve seen in more than a year.
What Happened to Bridge Loan Interest Rates in June?
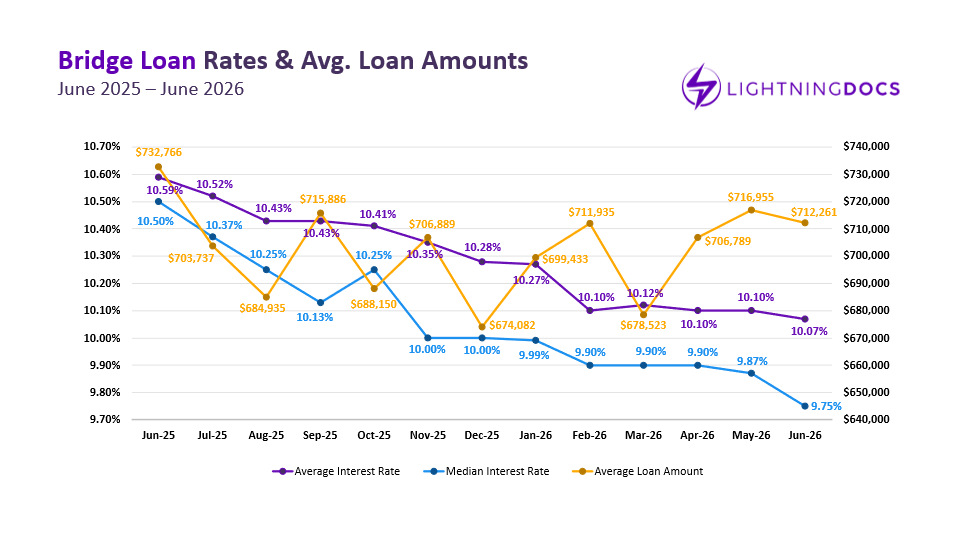
Average bridge loan interest rates eased slightly in June, falling 3 basis points to 10.07% after holding at 10.10% for two consecutive months. The median rate, meanwhile, dropped 13 basis points down to 9.75%. These declines, occurring alongside broader volatility elsewhere in the market, appear to be contributing factors behind renewed transaction growth. Average bridge loan amounts also edged down, from $717,000 to $712,000, a shift small enough to suggest that rate movement, rather than deal size, is the more likely driver of the volume increase.
Are Bridge Loan Rates Becoming More Widely Dispersed?
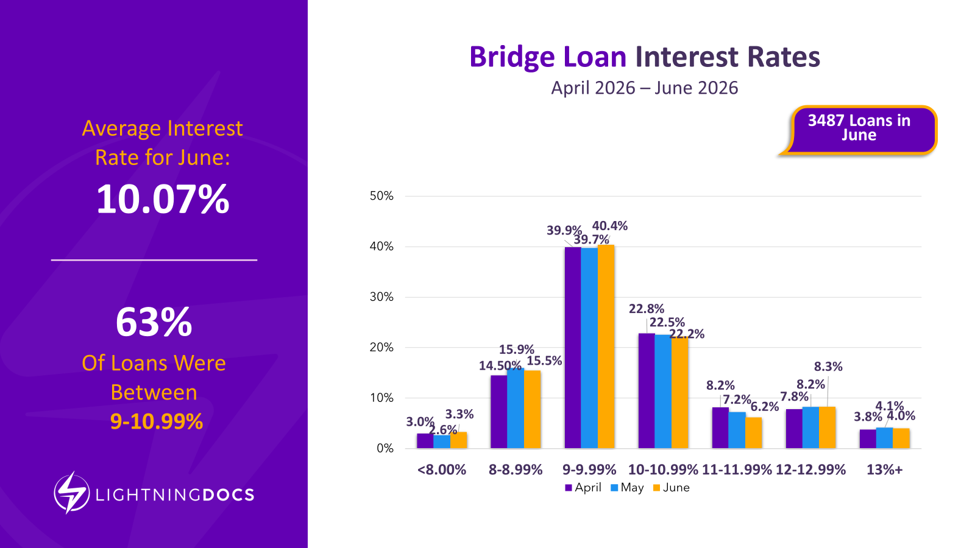
Bridge loan pricing has grown more dispersed in recent months even as the average rate has remained relatively steady. Both the sub-10% and above-12% segments expanded in June, while loans priced in the 10-11.99% middle band contracted.
Which States are Leading Bridge Lending Competition?
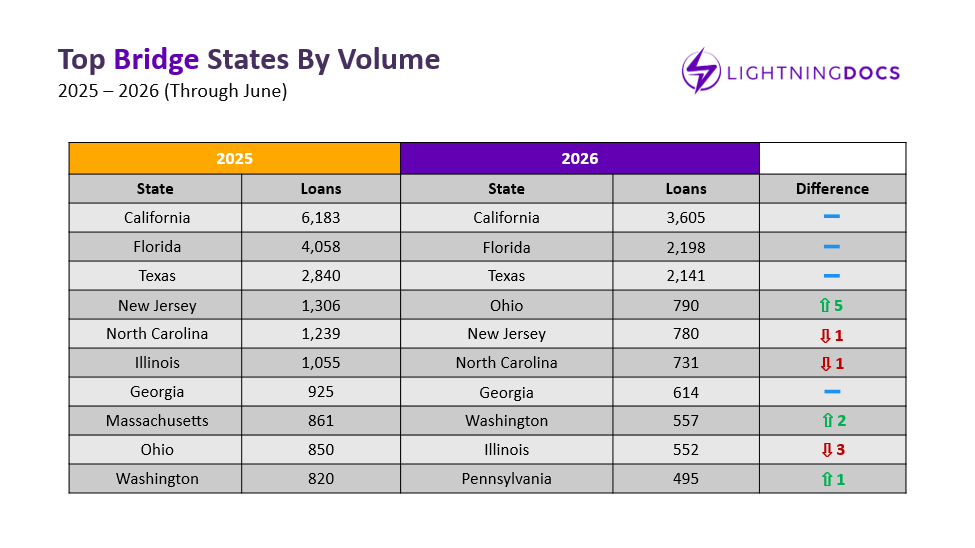
Texas strengthened its position in June, closing the gap with Florida for the number two spot on the year and outperforming it by 70+ loans during the month. Virginia stood out with a volume surge of nearly double its May figures, while Massachusetts continued a steady climb that now places it just outside the top ten states for the year.
Which Counties are Driving Bridge Loan Volume?
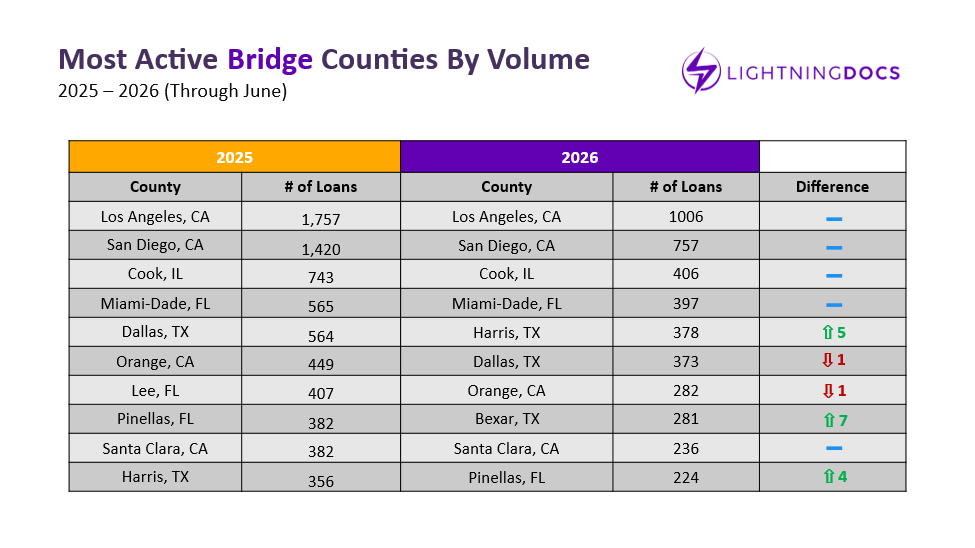
Los Angeles and San Diego remained the clear leaders in bridge lending by county, each producing more than double the volume of any other county in June. Travis County, Texas (Austin), was a standout mover, generating 44 loans in the month alone, more than its combined total for the first three months of the year. Maricopa County, Arizona (Phoenix), while still outside the top 10 at 13th on the year, has seen top 10 transaction volume for past three months.
What Happened to DSCR Lending Volume in June?
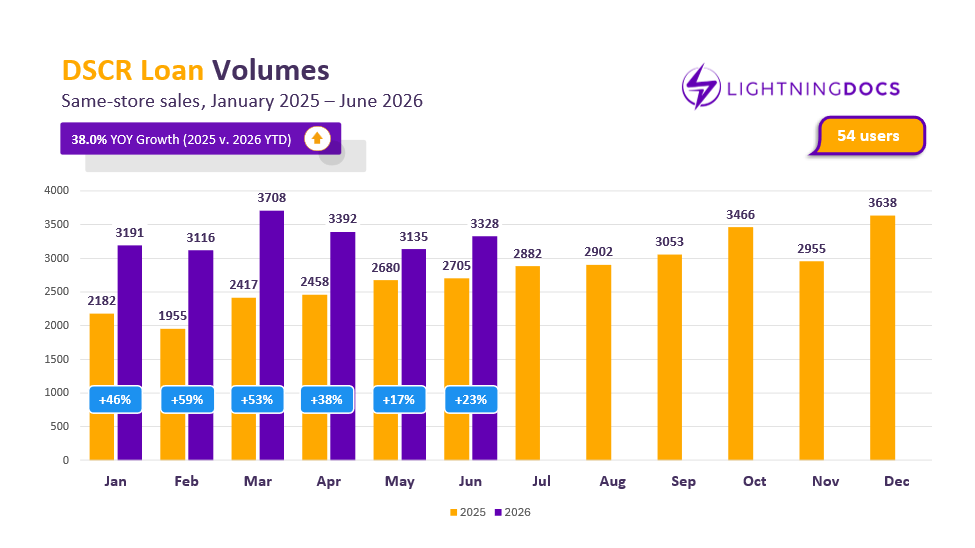
Despite contracted growth, DSCR lending remained solid in June, posting 3,328 transactions across same-store sales for 23% year-over-year growth, even as bridge lending’s resurgence reshaped the broader narrative. Even with smaller monthly growth on a year-over-year basis, for the year overall DSCR is still comfortably ahead, up 38% compared to 10% for bridge lending through June. The month’s volume also broke a two-month streak of declining transactions, indicating the segment may be stabilizing rather than continuing to lose ground.
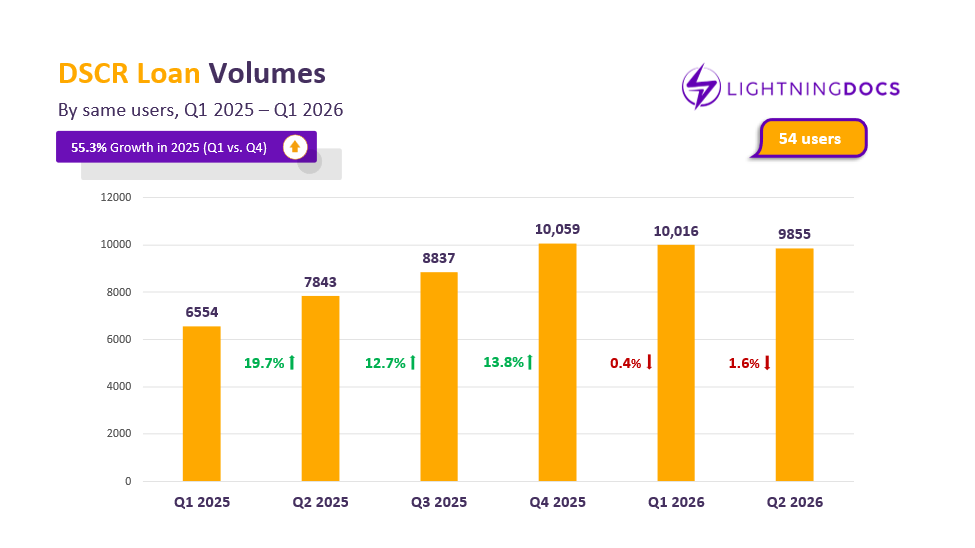
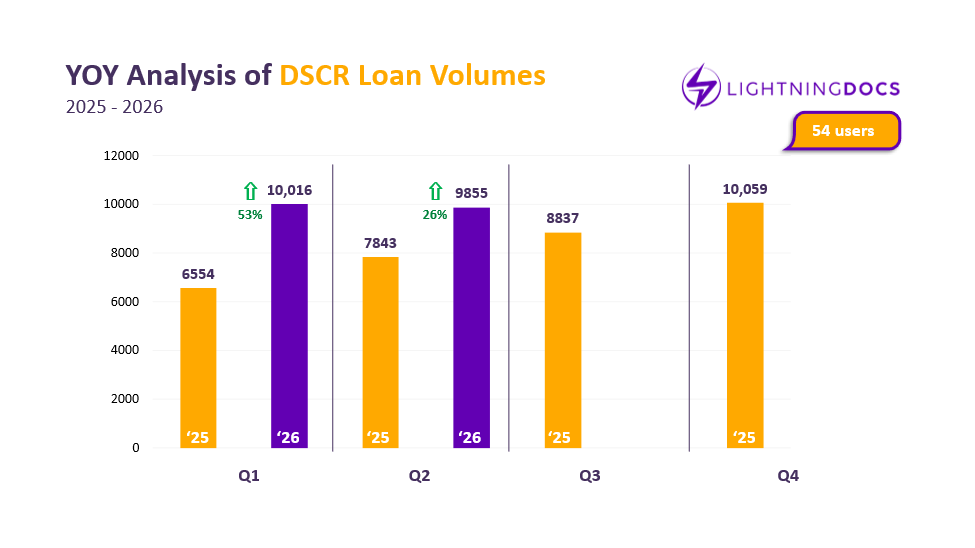
From a quarterly perspective, DSCR lending has cooled from the record highs of 2025. Transaction volume declined slightly for the second consecutive quarter in Q2 2026 compared to the prior quarter. Even so, Q2 2026 still outpaced Q2 2025 by 26%, proving that demand remains strong despite a slower pace of growth.
How DSCR Rates Rose in June
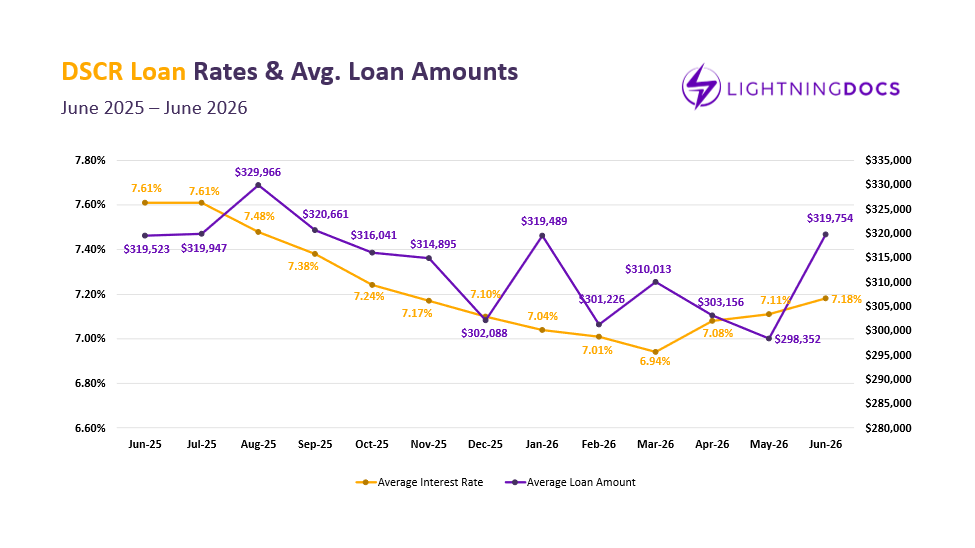
DSCR interest rates rose for a third consecutive month in June, climbing 7 basis points to 7.18%, the highest level since October 2025. Average loan amounts increased as well, up more than $20,000 to $319,754, the largest monthly increase in the past year, though still within a historically normal range.
How is the DSCR Rate Distribution Shifting?
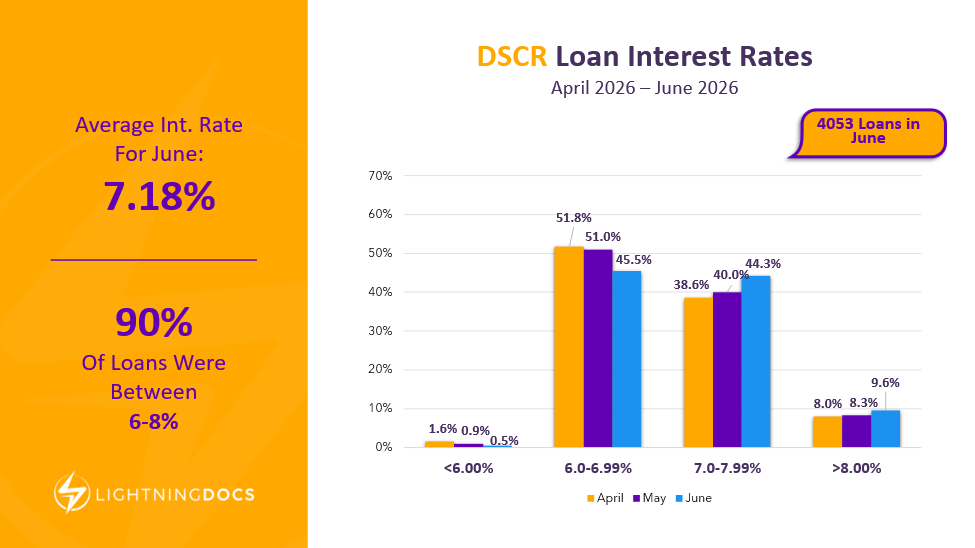
The DSCR market is steadily moving away from its lowest rate tier as overall rates climb. Loans priced below 6% continue to shrink as a share of the market, and now less than half of all DSCR loans are priced below 7%. Meanwhile, the 7-7.99% and 8%-plus bands have each expanded for two consecutive months. This migration toward higher-rate tiers is consistent with the overall upward trend in average DSCR pricing.
How are Bridge and DSCR Rates Responding to Benchmark Rates?
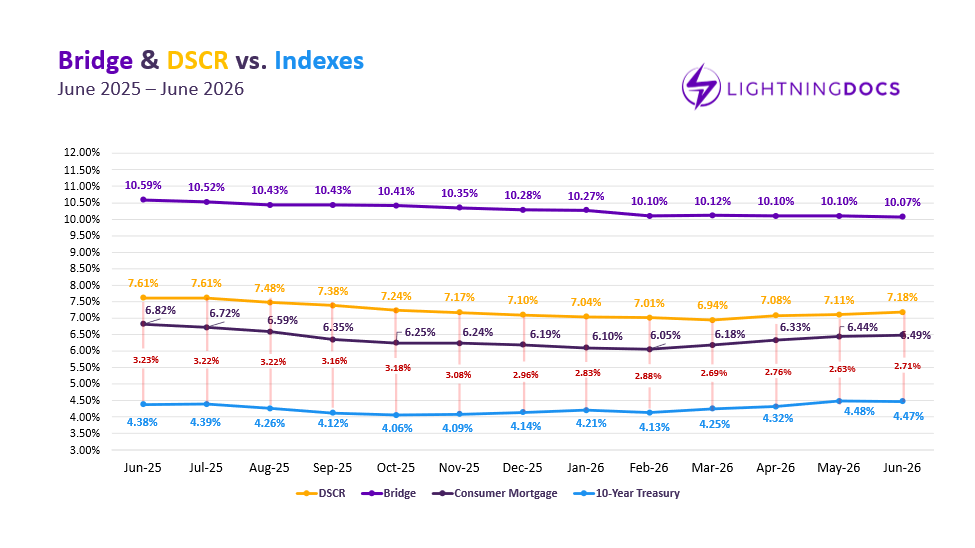
Private lending rates showed mixed alignment with benchmark rates in June, with DSCR rates rising even as the 10-year Treasury yield ticked down. The 10-year treasury yield fell 1 basis point to 4.47% after three consecutive monthly increases, while consumer mortgage rates moved in the opposite direction, rising 5 basis points to 6.49%.
This divergence raises the question of whether DSCR and consumer mortgage rates are lagging behind Treasury movements and could reverse course in the coming months if that relationship holds. Lenders and investors tracking rate-sensitive products may want to watch this spread closely. For now, spreads remain compressed below historical lows for an extended period, demonstrating continued capital markets demand for the product.
Which States are Leading DSCR Lending?
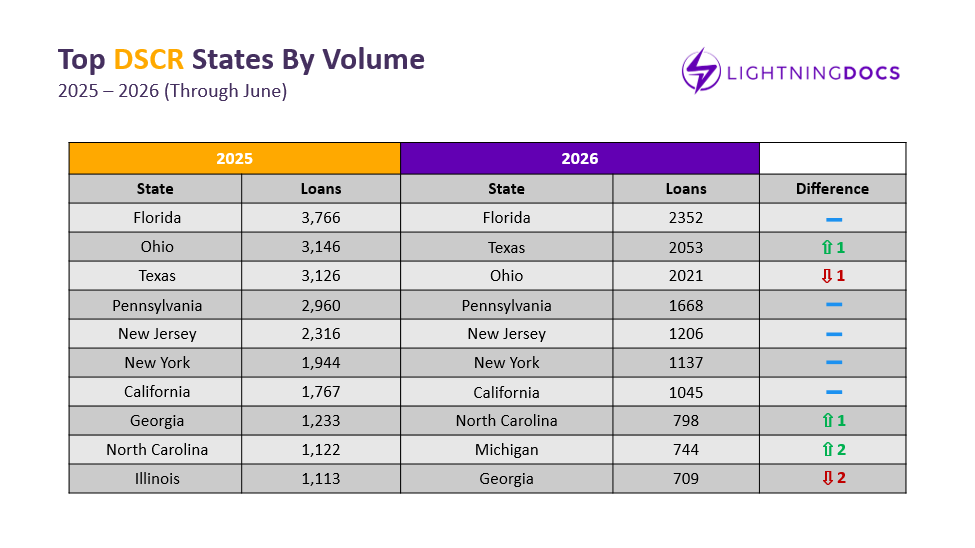
Florida claimed the top spot in DSCR lending in June after running nearly even with Texas over the prior two months. Missouri, Illinois, and Tennessee each broke the 100-loan threshold for the month, a notable volume even though none currently ranks among the top ten states for the year. North Carolina, by contrast, has seen volume decline for three consecutive months, after a strong start to 2026.
Which Counties are Leading DSCR Lending?
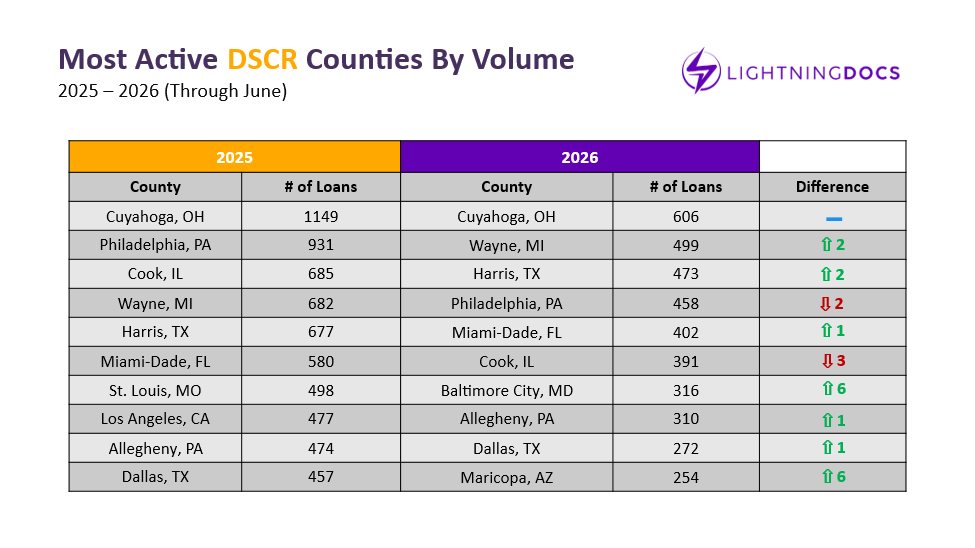
Philadelphia stood out as the only county to surpass 100 DSCR loans in June, reinforcing its position as the current number four market for the year. Cuyahoga County, Ohio, which had led every prior month in 2026, slipped to fourth by volume in June, an unusual break from its consistent run atop the rankings.
June’s Private Lending Takeaways: What Does the Data Mean for Lenders and Investors?
Taken together, June’s data presents a momentum shift toward bridge lending following 2025’s DSCR-led growth. Bridge lending’s resurgence, paired with modestly falling rates and a wider dispersion in pricing, points to renewed investor appetite for shorter-term, transitional financing. At the same time, DSCR lending’s rising rates and shifting rate distribution suggest a segment that remains fundamentally strong but is adjusting to a higher-rate environment. Ultimately, treasury volatility will continue to be the headline, which will likely shape Q3 results for the industry as a whole.