Definitions and Methodology
Definitions
A bridge loan is any loan with a duration of 36 months or less utilizing interest-only payments for the duration of the term and containing a balloon payment at the end of the loan. Bridge loans are commonly referred to as residential transition loans (RTL), fix-and-flip, non-owner occupied, hard money, or in other terms that describe a short-term loan generally secured by a residential property for investment purposes.
DSCR loans are 30-year term loans secured by rental properties. DSCR stands for Debt Service Coverage Ratio, which identifies that the primary underwriting for these loans is done by dividing the monthly net operating income of the property by the monthly debt service.
A User refers to a unique company using the Lightning Docs platform. If multiple individuals within the same company access the platform, they are collectively counted as a single user.
Methodology
Loans below $50,000 and above $5,000,000 have been removed from the data set.
Loans with interest rates below 4% and above 20% have been removed from the data set.
For the loan volume slides, the user must have signed up with Lightning Docs prior to 2024
We’re just days away from finding out the Fed’s decision on rates in September. With many pundits predicting a rate cut, we’ll see if that holds true, and if so what kind of impact the first change since December of 2024 might have on our industry.
With summer coming to an end and two-thirds of the year now behind us, DSCR loans continue their rapid climb. Trends remain consistent: interest rates are falling, average loan amounts are stable, and benchmark indexes show little volatility.
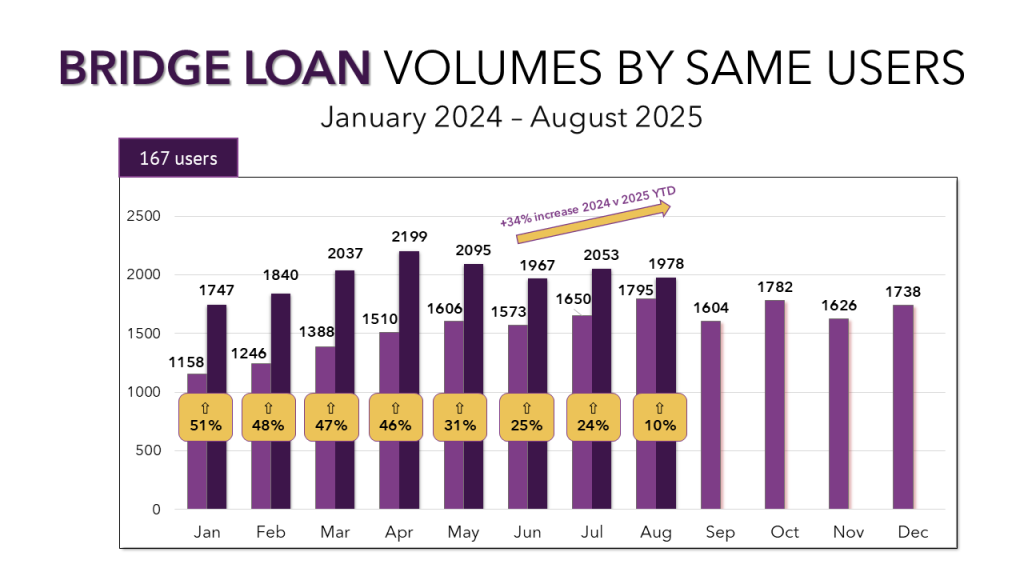
Bridge Loans Slowing Down
Bridge loan activity has cooled in recent months. August saw 1,978 loans from users active on Lightning Docs since the start of 2024, keeping volumes near 2,000 for the fourth straight month. Even so, activity was up 10% year-over-year. Year-to-date growth stands at 34%, though the pace has slowed as 2025 has progressed.
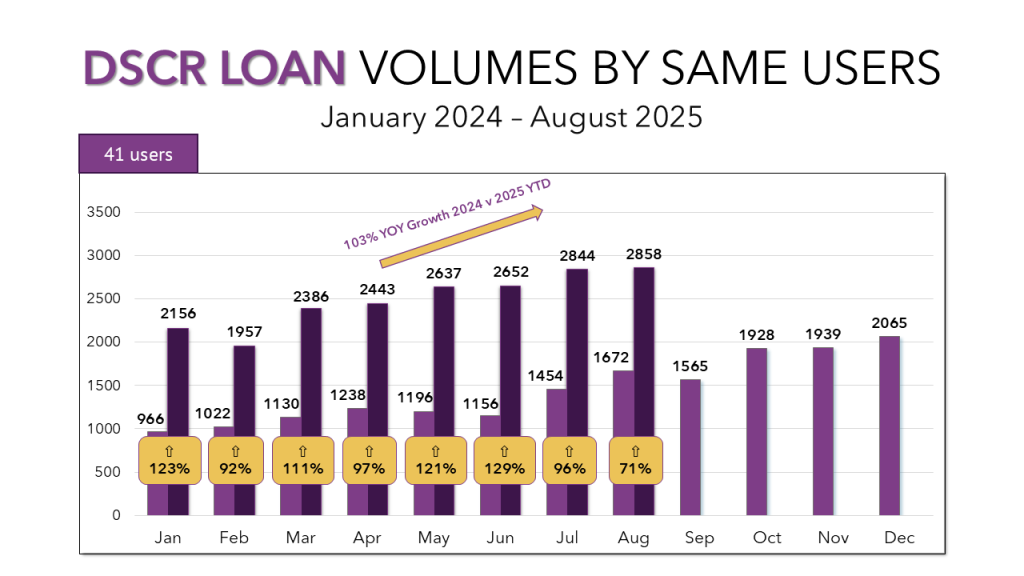
DSCR Loans Continue Climbing
DSCR loan activity remains at record highs, with August marking the seventh record-setting month of 2025. Users who have been active since January 2024 originated 2,858 DSCR loans in August, essentially tripling what those same users output in January 2024. DSCR growth continues across a wide range of markets nationwide.
Bridge Loan Interest Rates and Loan Amounts
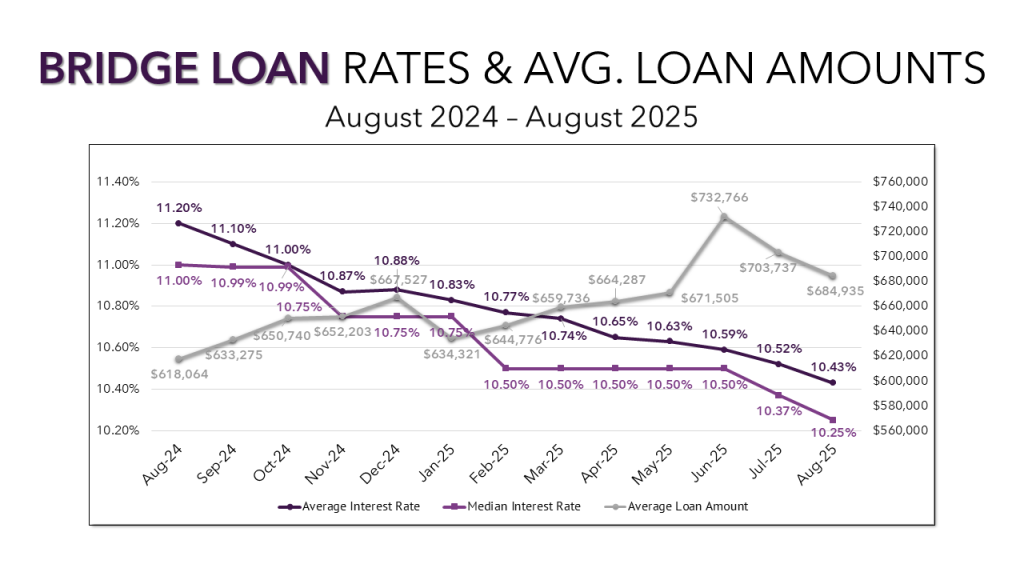
Average bridge loan amounts declined for a second consecutive month to just under $685,000, after spiking to more than $732,000 in June. Rising inventory and longer days on market in some markets suggest housing costs could be easing.
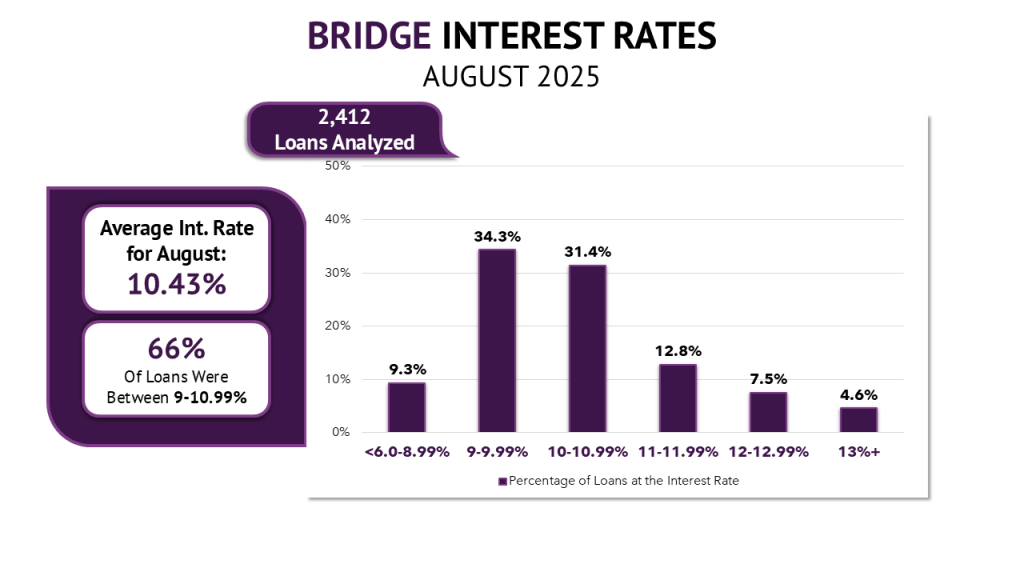
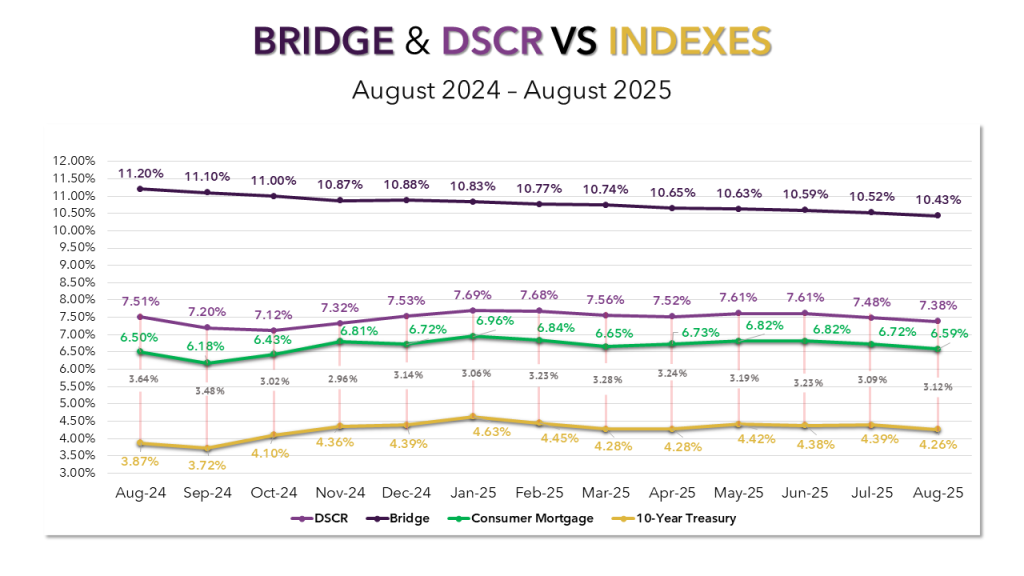
Bridge interest rates continued their downward trend, averaging 10.43% in August, with the median at 10.25%, both multi-year lows. August also brought a sharp shift in rate distribution, with loans in the 9–9.99% range now representing the largest share (34.3%), compared to only 27% priced in that range in July.
DSCR Loan Interest Rates and Loan Amounts
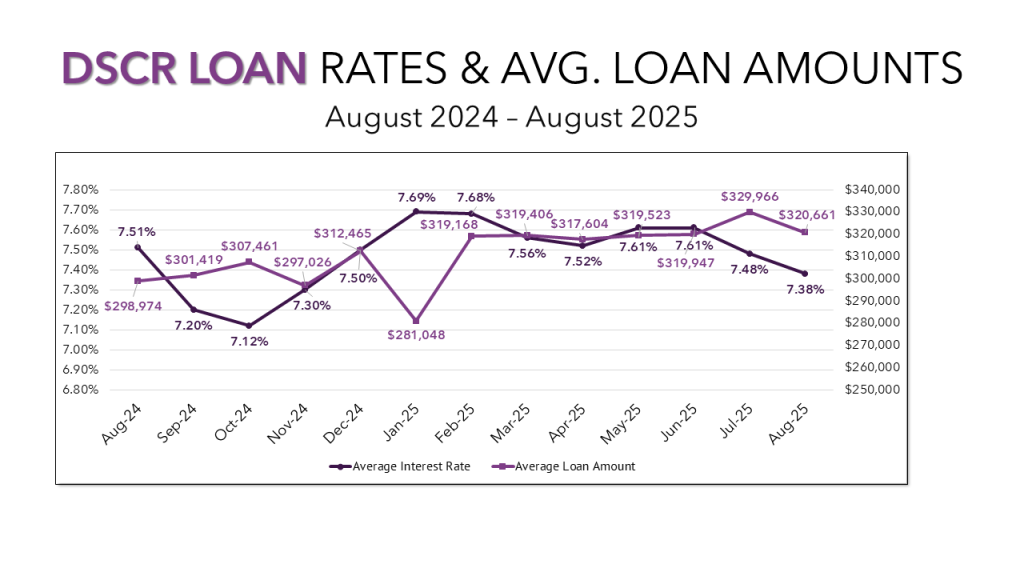
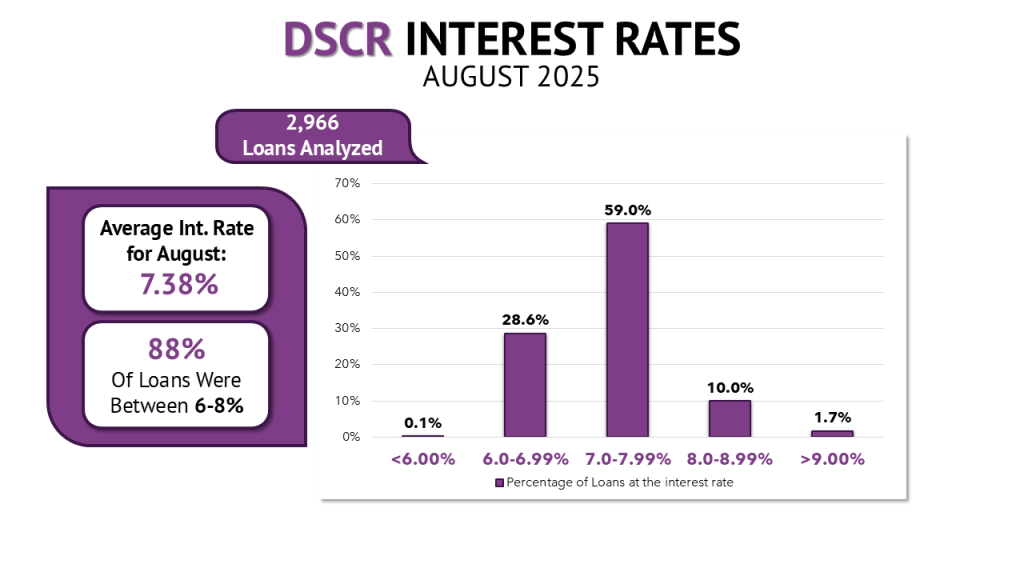
Average DSCR loan amounts returned to roughly $320,000, consistent with levels seen between February and June. Interest rates edged down another 10 basis points to 7.38%, the lowest since November 2024.
Interest rates showed little variation this month, with 59% of all DSCR loans falling between 7-7.99% and 88% of loans priced between 6-7.99%.
Rates Drop Across the Board
All four tracked benchmarks—Bridge, DSCR, Consumer Mortgages, and the 10-Year Treasury—declined in August. Consumer Mortgage and 10-Year Treasury rates each fell by 13 basis points.
Within the month, 10-Year Treasuries proved more stable than in July, fluctuating within just 12 basis points from July 1 through July 31. With the DSCR–Treasury spread ticking up just slightly to 3.12%, capital markets’ demand for the product remains strong.
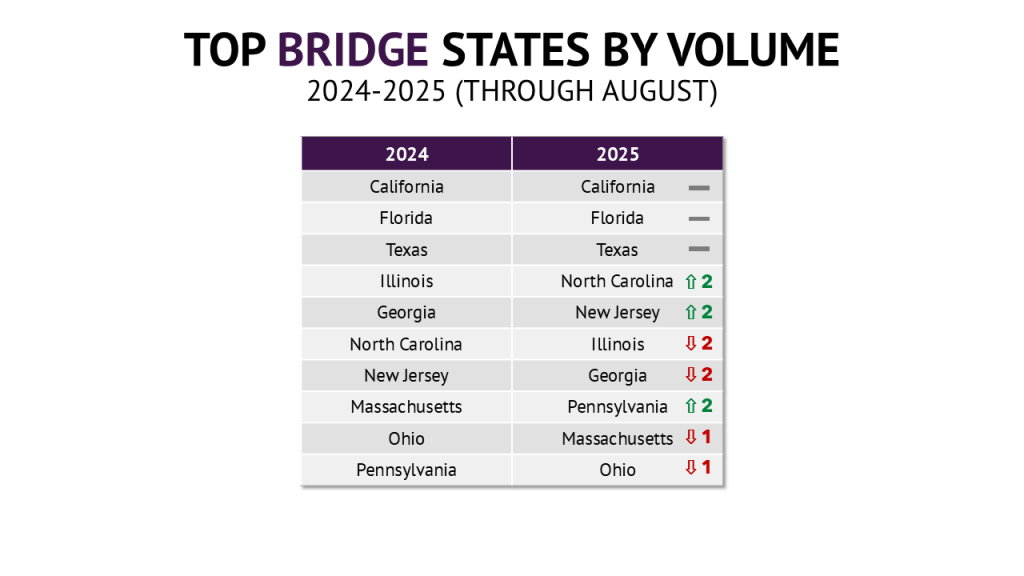
North Carolina on the Rise
Three states in the top 10 recorded their highest loan volumes of the year in August. North Carolina stood out with 128 loans, moving into the number four spot, while California and Texas also hit their annual highs. Florida, despite a still-impressive 297 loans, had its lowest month of 2025.
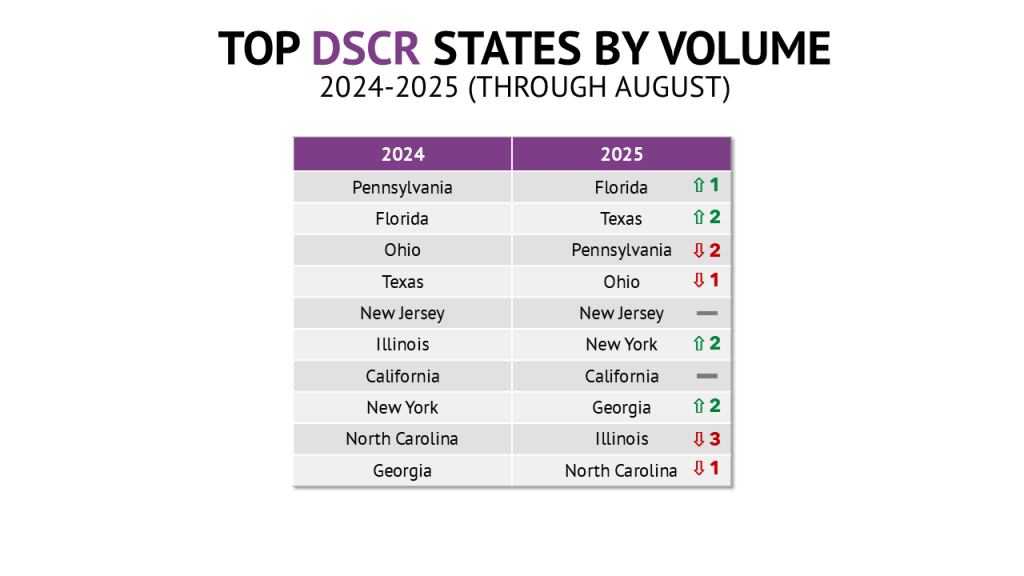
Keep an Eye on Tennessee
Texas matched its yearly peak with 297 DSCR loans, while Pennsylvania set a new monthly high with 257 loans. Tennessee, though not in the top 10 overall, crossed 100 DSCR loans in August, one of only eight states to reach that threshold.
Conclusion
August highlighted the growing divide in private lending. Bridge loans, which had been expanding earlier in the year, have now leveled off with volumes holding steady around 2,000 per month. DSCR loans, on the other hand, continue to be the clear growth story of 2025, setting record after record as investor demand remains strong across markets. With rates moving lower in every category and the Fed’s upcoming decision likely to influence the path forward, the final months of the year are shaping up to be pivotal for lenders and borrowers alike.