
With Veteran’s Day and Thanksgiving weekend on the calendar, November brought four fewer business days than October, so a dip in total loan volume wasn’t surprising. Even so, when measured on a per-business-day basis, loan transactions actually increased again this month.
While we’re still waiting to see the lasting effects of the most recent rate cuts — and potentially a third coming this month — average interest rates for both bridge and DSCR loans continued their steady decline.
Definitions and Methodology
Definitions
A bridge loan is any loan with a duration of 36 months or less utilizing interest-only payments for the duration of the term and containing a balloon payment at the end of the loan. Bridge loans are commonly referred to as residential transition loans (RTL), fix-and-flip, non-owner occupied, hard money, or in other terms that describe a short-term loan generally secured by a residential property for investment purposes.
DSCR loans are 30-year term loans secured by rental properties. DSCR stands for Debt Service Coverage Ratio, which identifies that the primary underwriting for these loans is done by dividing the monthly net operating income of the property by the monthly debt service.
A User refers to a unique company using the Lightning Docs platform. If multiple individuals within the same company access the platform, they are collectively counted as a single user.
Methodology
Loans below $50,000 and above $5,000,000 have been removed from the data set.
Loans with interest rates below 4% and above 20% have been removed from the data set.
For the loan volume slides, the user must have signed up with Lightning Docs prior to 2024
Bridge Loan Volumes
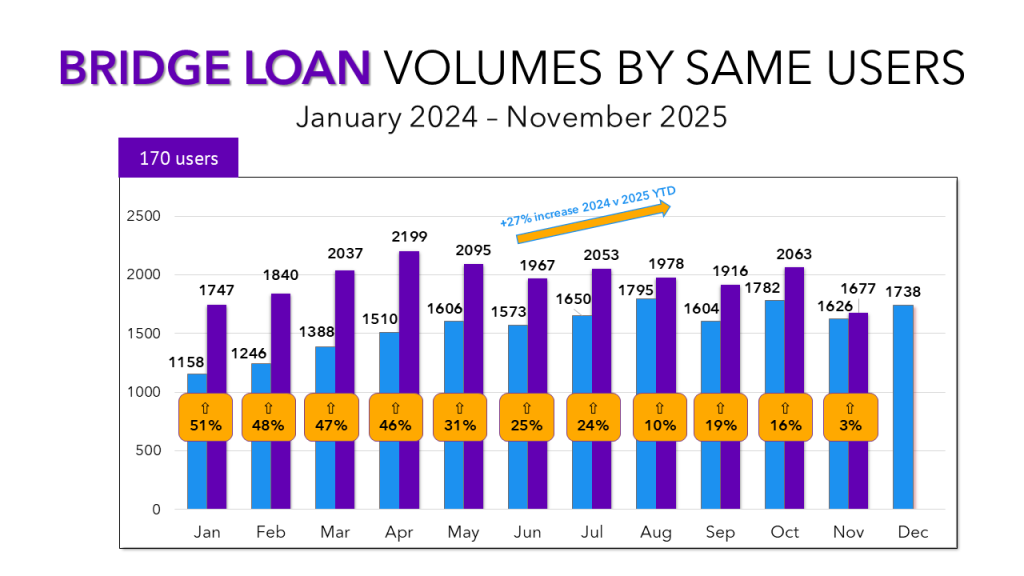
Bridge loans felt the impact of the shorter month the most, falling nearly 20% from October. October’s rebound now appears more like a brief uptick than a sustained recovery. December will be key: without a strong finish, bridge lending risks posting its first month of negative year-over-year growth.
Average Bridge Loan Interest Rates and Loan Amounts
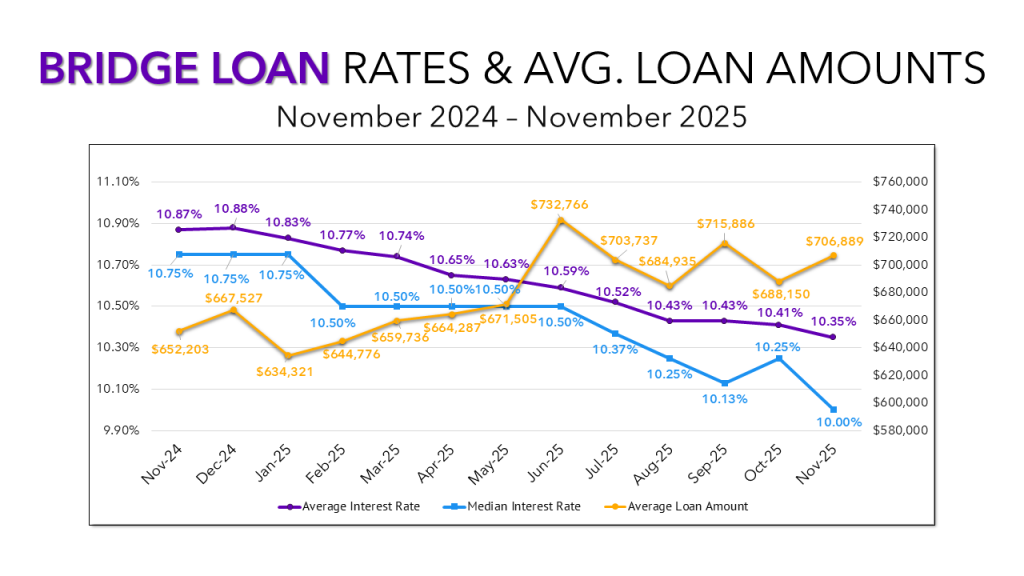
Average loan amounts climbed to nearly $707,000 — about $20,000 higher than last month. At the same time, rates continued to soften. The average interest rate dropped 6 basis points to 10.35%, and the median rate fell to 10.00%, the lowest level in more than a year.
Bridge & DSCR vs Indexes
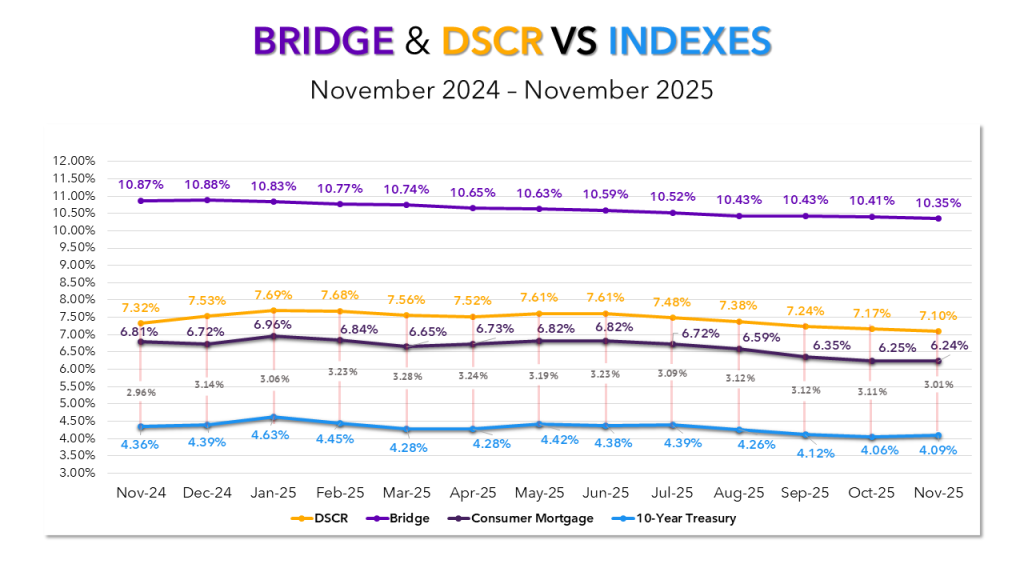
As noted earlier, the long-term effects of the rate cuts have yet to materialize. Despite a 3-basis-point increase in 10-year treasuries in November — the first uptick after three months of declines — none of the other rates we tracked showed an increase. Consumer mortgage rates slipped by a basis point, bridge rates fell by six, and DSCR rates dropped by seven. With DSCR moving lower as treasuries ticked up, the spread between the two tightened to 3.01%, signaling continued strong demand for DSCR lending.
Top States for Bridge Loans
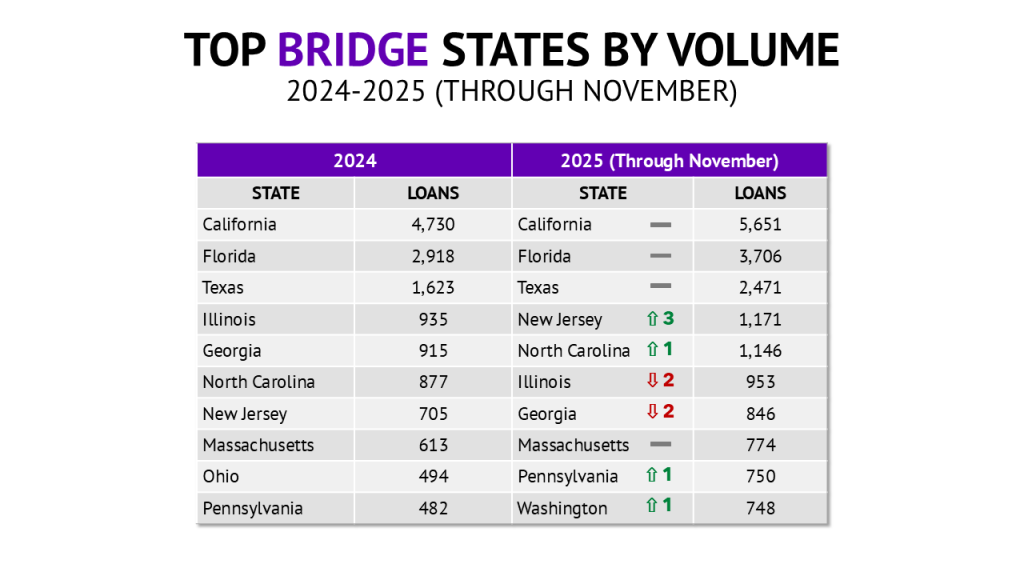
Texas was the only state in the top 10 to grow its bridge loan volume from October to November. South Carolina was the only other state in the top 25 to show an increase. Several states — including Oregon, Maryland, Colorado, and Hawaii — managed to match their October volumes despite the abbreviated month.
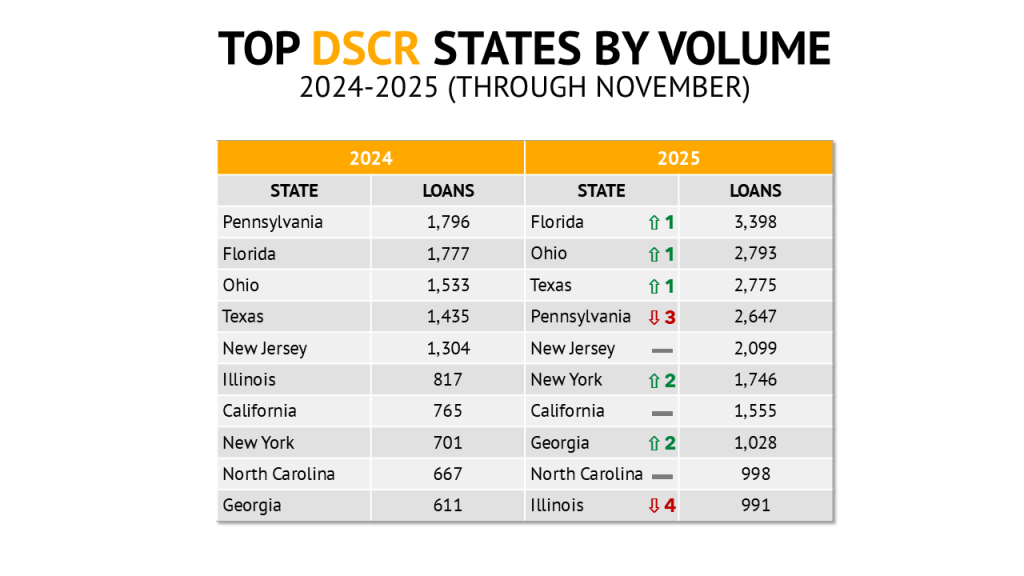
Top DSCR States
Among the top 10 DSCR states, only North Carolina showed an increase in volume. However, traction was stronger just outside the top tier. Maryland, Tennessee, and Indiana each saw impressive growth for such a short month. Maryland (121 loans) and Indiana (80 loans) logged their strongest months of 2025.
As we approach the end of 2025, one trend stands out: DSCR lending has driven much of the year’s growth across the country. What’s less certain is how rates will evolve following the recent Fed decisions, and whether bridge lending can rebound from the slowing growth we’ve seen.
What is clear is that private lenders have remained resilient during a year defined by uncertainty and constant macroeconomic shifts. Those who stayed focused on scaling and invested in tools that allowed them to concentrate on the core of their business continued to grow, a trend reflected in Lightning Docs users, who have achieved 60% year-over-year growth.
Click the button below to access the full report which has details on:
- Distribution of Interest Rates
- Trends Among the Most Active Counties in 2025
- Highest Average Loan Amounts (County and State)
- Highest Average Interest Rates (County and State)