

Definitions and Methodology
Definitions
A bridge loan is any loan with a duration of 36 months or less utilizing interest-only payments for the duration of the term and containing a balloon payment at the end of the loan. Bridge loans are commonly referred to as residential transition loans (RTL), fix-and-flip, non-owner occupied, hard money, or in other terms that describe a short-term loan generally secured by a residential property for investment purposes.
DSCR loans are 30-year term loans secured by rental properties. DSCR stands for Debt Service Coverage Ratio, which identifies that the primary underwriting for these loans is done by dividing the monthly net operating income of the property by the monthly debt service.
A User refers to a unique company using the Lightning Docs platform. If multiple individuals within the same company access the platform, they are collectively counted as a single user.
Methodology
Loans below $50,000 and above $5,000,000 have been removed from the data set.
Loans with interest rates below 4% and above 20% have been removed from the data set.
For the loan volume slides, the user must have signed up with Lightning Docs prior to 2024
Will the second half of the year match the growth and stability we saw in the first half? With the first month of Q3 behind us, those trends are holding firm so far. What started as a relatively slow July—thanks to the 4th landing on a Friday and giving many a long weekend—ended as a record-breaking month for Lightning Docs users who’ve been with us since 2024.
Whether that momentum carries into the fall remains to be seen. July closed with the Fed holding rates steady for a fifth consecutive meeting. And while Fed Chair Jerome Powell gave no indication of a policy shift at the next meeting in mid-September, speculation is already growing that a rate cut may be on the table. Macroeconomic uncertainty remains prevalent, but private lending has continued its steady rise throughout 2025.
Let’s dive into how interest rates, loan amounts, and regional trends played out last month.
Bridge Loan Volumes
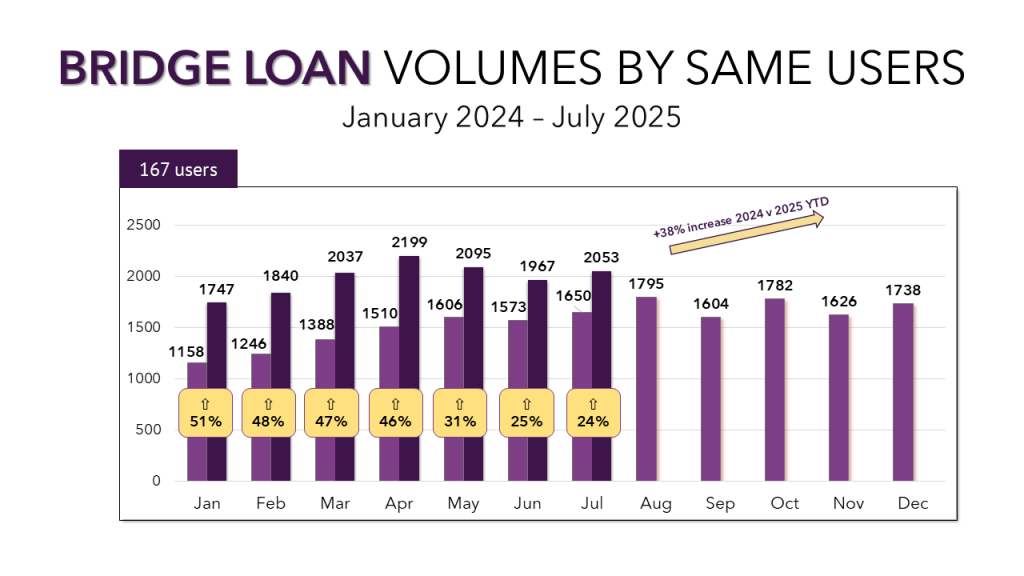
With a longer month, bridge loan volumes climbed back above 2,000 in July, ending at 2,053. That’s a 24% increase over July 2024 and a 38% year-to-date gain for Lightning Docs users active since January 2024. As you’ll see later on, while some markets—like San Diego—continue to thrive, the broader national trend shows that bridge loan growth has been gradually slowing since April.
DSCR Loan Volumes
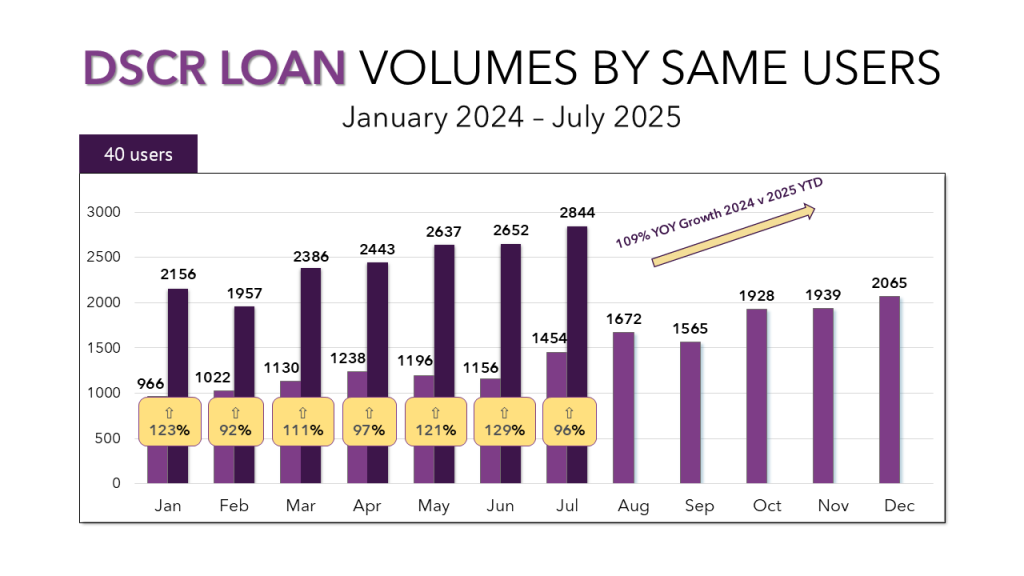
DSCR loans remain one of the year’s strongest stories. In July, 2,844 loans were created in Lightning Docs by just 40 DSCR users who’ve been with us since the start of 2024. That marks a 96% increase compared to last July, and a 109% year-to-date gain. The momentum behind DSCR lending shows no signs of fading.
Bridge Loan Interest Rates and Loan Amounts
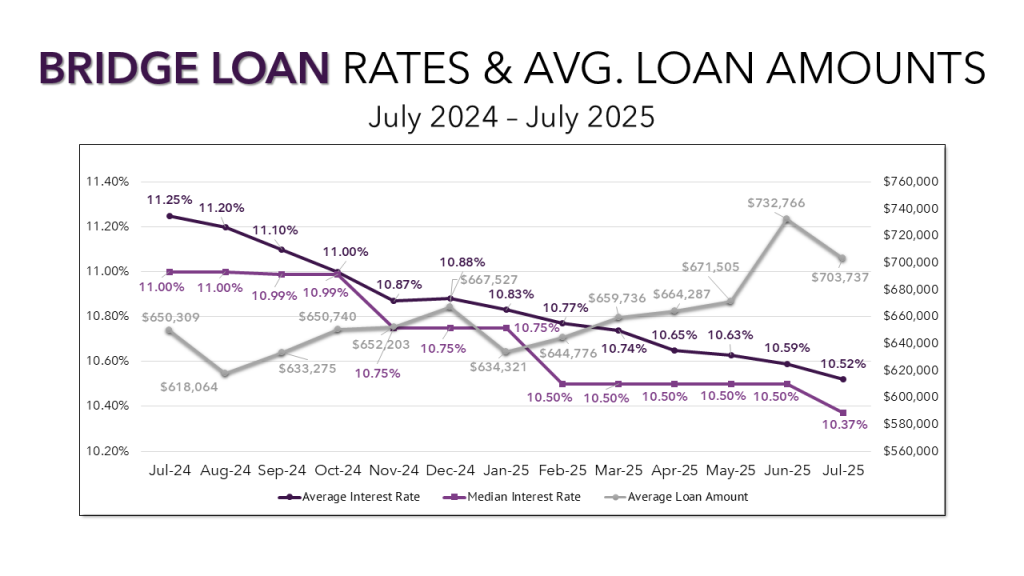
Average bridge loan interest rates fell again in July, dropping 7 basis points to 10.52%. Median rates fell 13 basis points to 10.37%, their first movement since February. Meanwhile, average loan amounts dipped to $703,737. Though down from the June spike, that figure still represents one of the highest monthly averages in recent years.
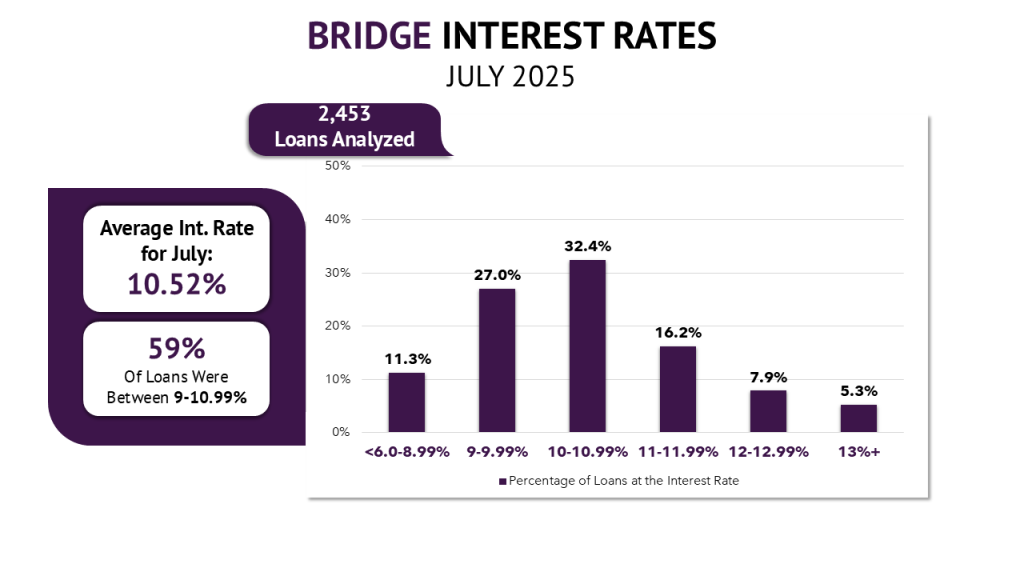
Looking closer at rate distribution: over 11% of bridge loans were priced below 9%, a full 70% of loans are now priced below 11%, even as we saw a slight increase in loans priced above 13%. The widening spread highlights how certain markets can develop their own distinct pricing trends. As you’ll see later, rate movement among the top 10 bridge loan markets was far from uniform.
DSCR Average Interest Rates and Loan Amounts
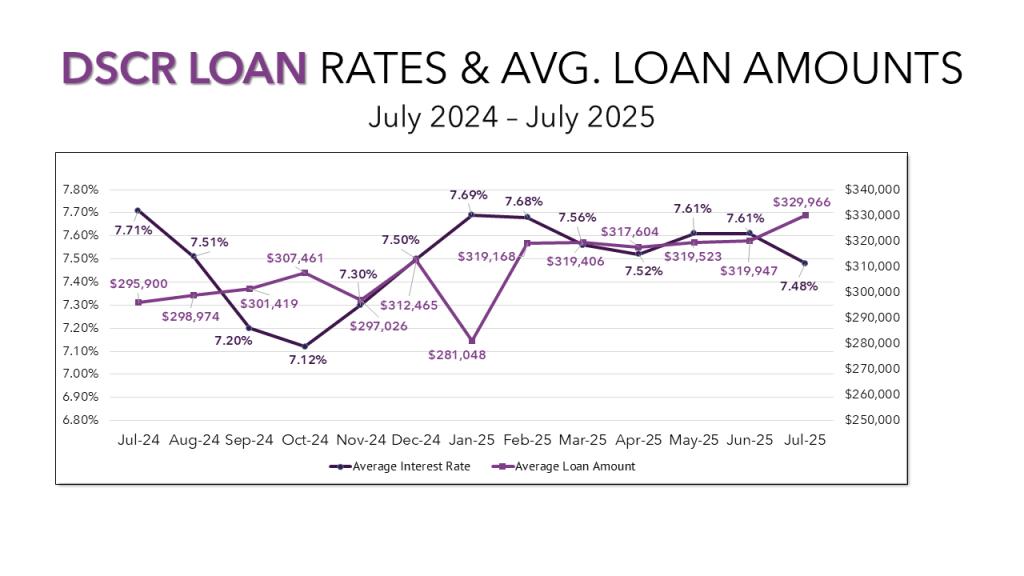
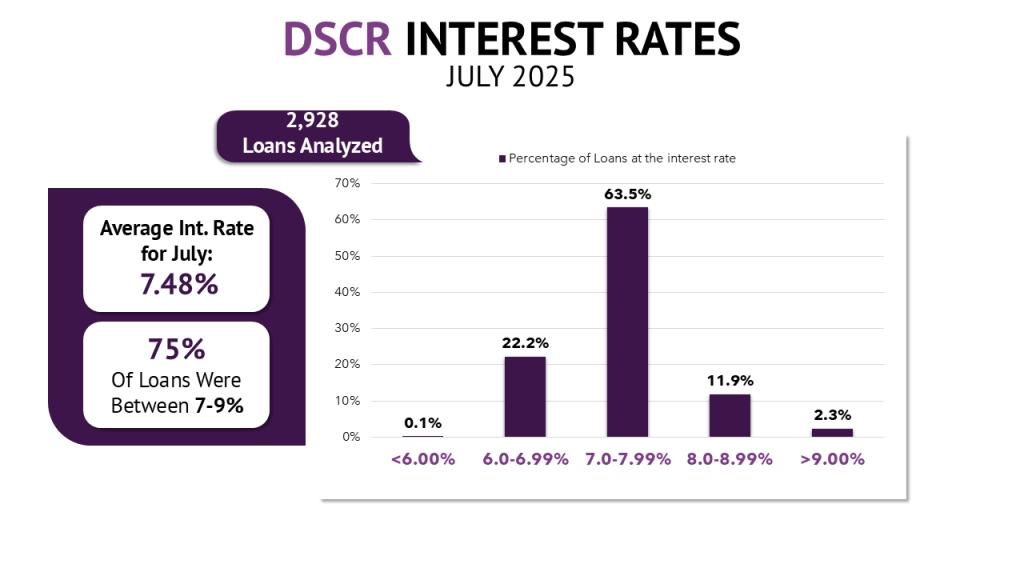
DSCR loans saw an even sharper decline in rates, with the average falling 13 basis points to 7.48%. On the flip side, average loan amounts rose to $329,966, continuing a multi-year high. That $10,000 jump follows five straight months where loan amounts stayed within a narrow $3,000 range.
Nearly a quarter of DSCR loans are now priced between 6–6.99%, showing a meaningful shift away from the average and toward more favorable pricing for many borrowers.
Bridge & DSCR VS Indexes
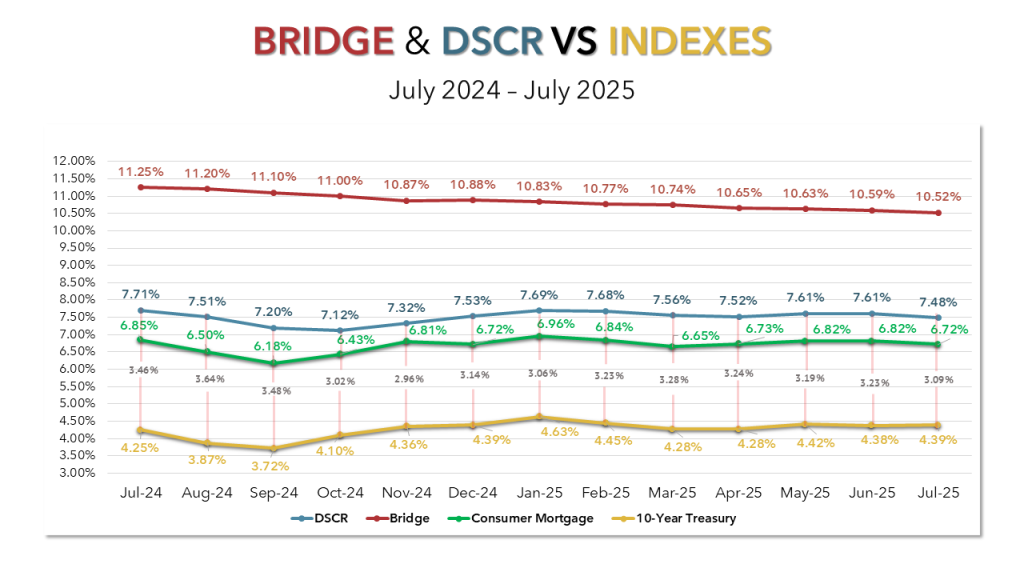
Consumer mortgage rates followed a similar pattern in July, falling by 10 basis points. The 10-year Treasury, however, ticked up slightly to 4.39%, tightening the spread between it and DSCR rates to just 3.09% — the narrowest margin we’ve seen since January. The tightening of spreads demonstrates capital markets acceptance and desire for this loan product.
While monthly averages are helpful for tracking trends, your experience in July may have felt different. The 10-year Treasury opened the month at 4.26%, peaked at 4.50% on July 15, and settled at 4.37% by month’s end. That intramonth volatility is worth watching as we head into August as it will help shape consumer and private lending rates more than any single data point.
Top States for Bridge Loans
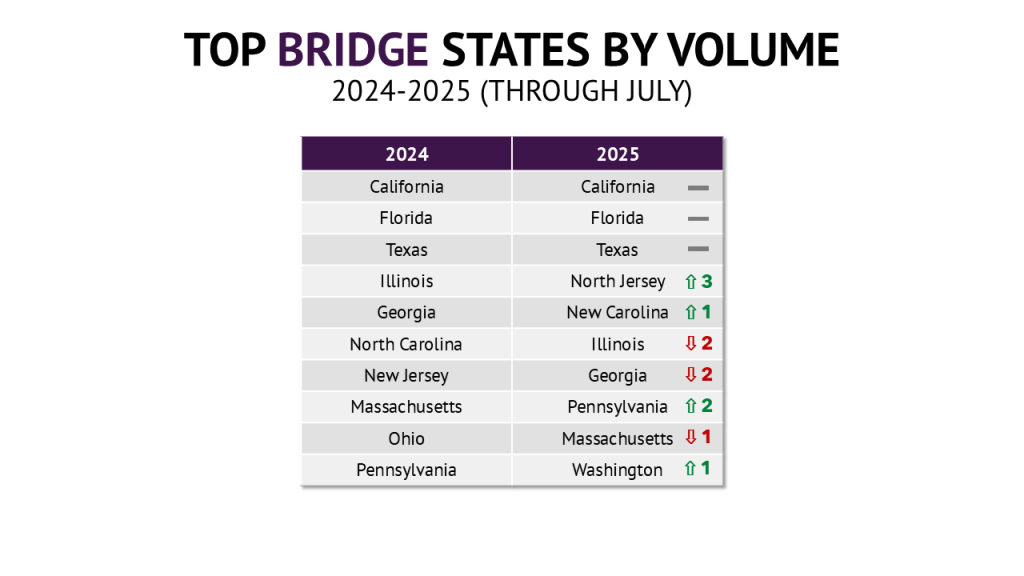
Washington joined the top 10 in July, becoming just the second western state on the list alongside California. New Jersey climbed to the fourth spot, swapping places with North Carolina. As we’re accustomed to seeing, California, Florida, and Texas held down the top 3 spots on the list.
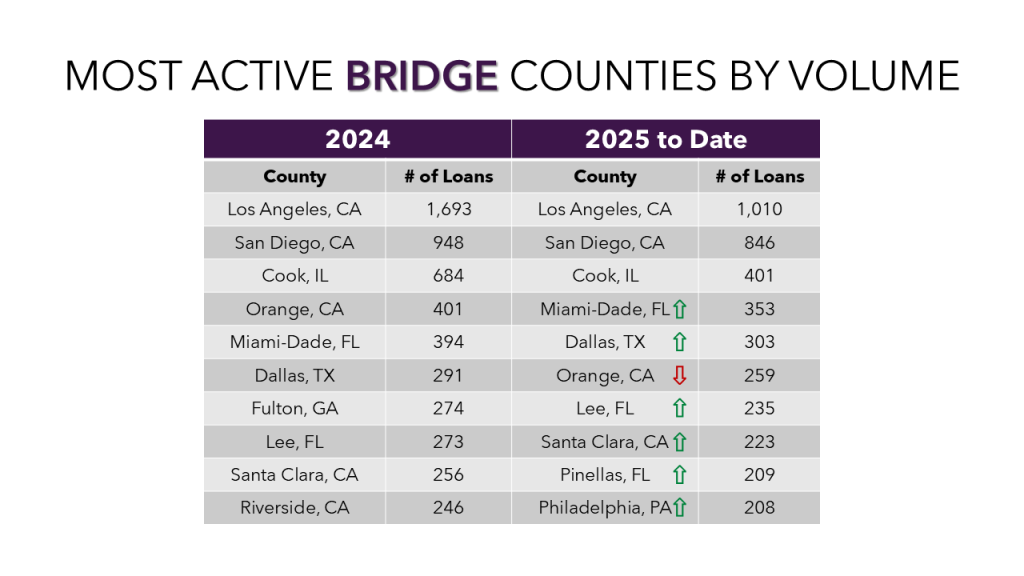
Top Counties for Bridge Loans
There’s a reason California, Florida, and Texas dominate this space: eight of the top 10 counties are in those three states. Expand to the top 20, and 15 are located there. Zoom out even further and over half — 29 of the top 50 — are from just those three states.
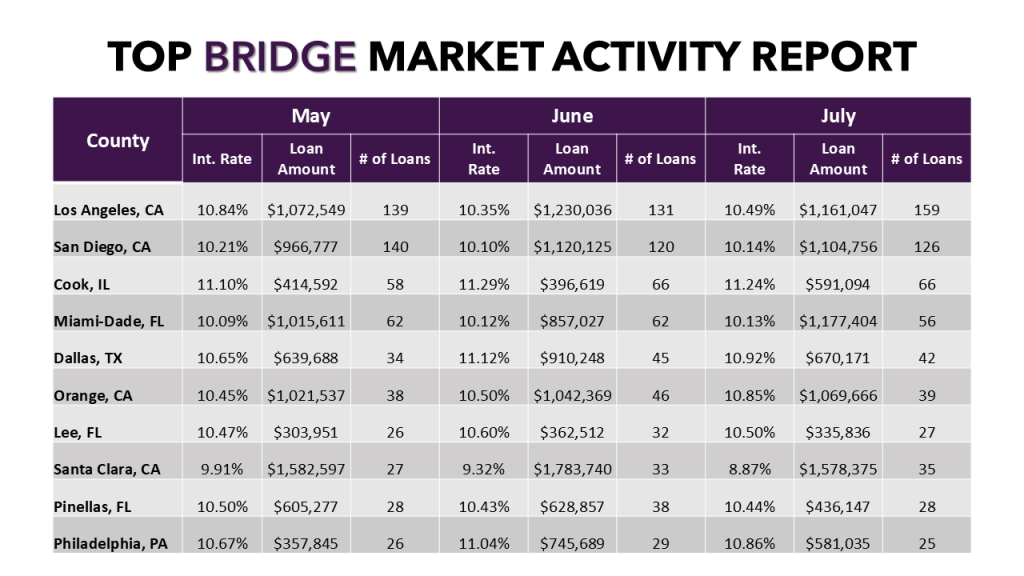
A Deeper Look into the Top 10 Bridge Markets
This month reinforced just how local rate trends can be. Nationally, average bridge rates dropped 7 basis points. But in Los Angeles, our largest market, they rose 14 basis points. Half of the top 10 markets saw higher rates in July than in June, with Orange County jumping up by 35 basis points.
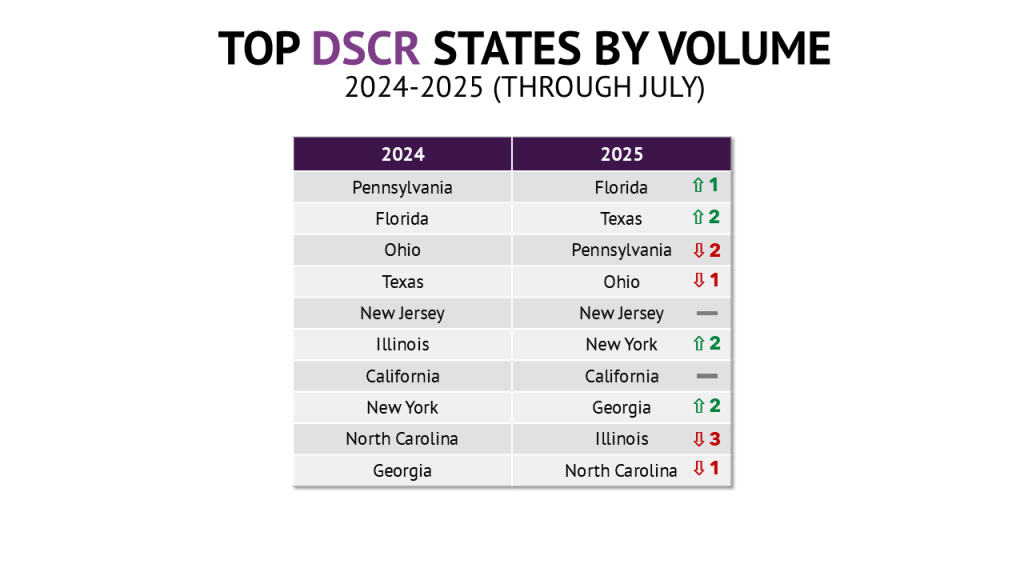
Top DSCR States
The top 10 states for DSCR loans remained unchanged from June. What’s more notable is that several states — Florida, Ohio, Texas, New Jersey, New York, California, and Georgia — have already surpassed their total DSCR loan counts from all of 2024.
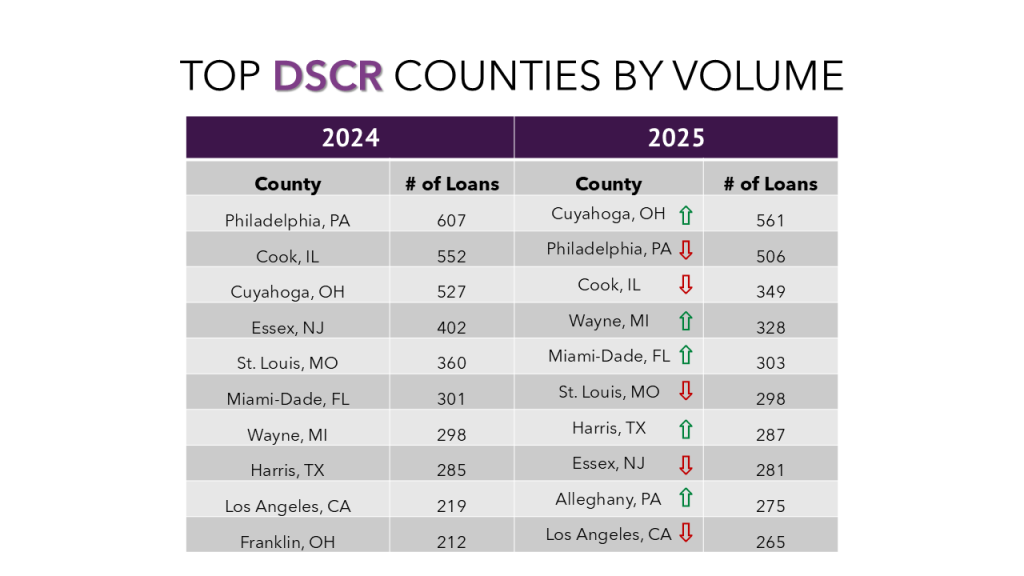
Top DSCR Counties
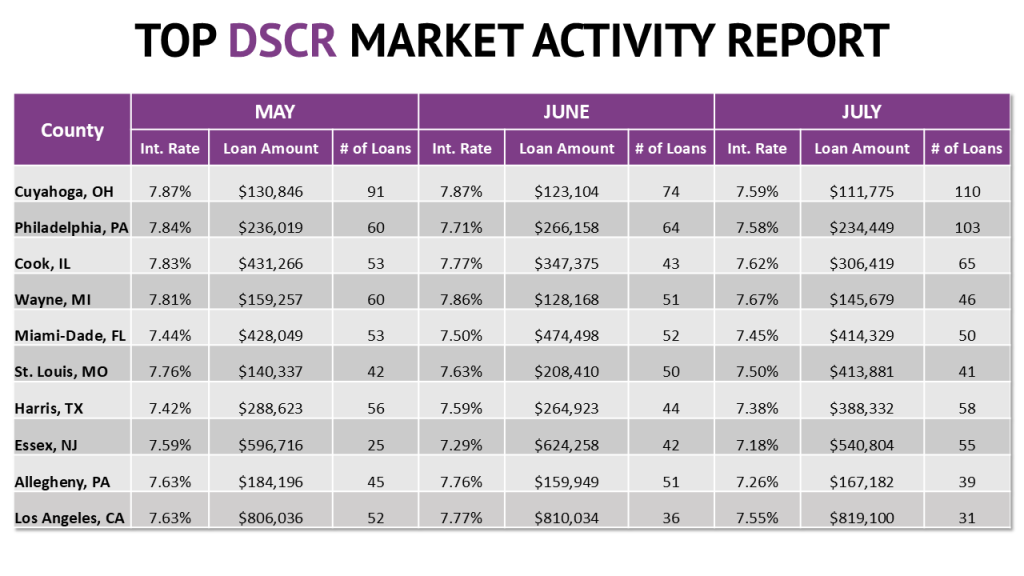
That surge isn’t limited to states. Counties like Cuyahoga, Wayne, Miami-Dade, Harris, Allegheny, and Los Angeles have also already exceeded their 2024 totals. The strength in DSCR lending is broad and growing.
Top DSCR Market Activity Report
Unlike bridge loans, the top 10 DSCR markets all followed the national trend, with every one of them seeing a decrease in average interest rates from June to July.
Conclusion
The private lending market continues to evolve rapidly, and lenders are adapting just as quickly by finding ways to do more with less, close deals faster, and stay competitive in a high-rate environment. While there is no one-size-fits-all playbook for growth, one theme keeps emerging: the lenders scaling the fastest are simplifying workflows, embracing automation, and cutting down on friction wherever possible. Among Lightning Docs users who have been with us since early 2024, average monthly loan volume has grown 2.35 times — a sign of just how much more efficiently today’s lenders are operating.