Definitions
A bridge loan is any loan with a duration of 36 months or less utilizing interest-only payments for the duration of the term and containing a balloon payment at the end of the loan. Bridge loans are commonly referred to as residential transition loans (RTL), fix-and-flip, non-owner occupied, hard money, or in other terms that describe a short-term loan generally secured by a residential property for investment purposes.
DSCR loans are 30-year term loans secured by rental properties. DSCR stands for Debt Service Coverage Ratio, which identifies that the primary underwriting for these loans is done by dividing the monthly net operating income of the property by the monthly debt service.
A User refers to a unique company using the Lightning Docs platform. If multiple individuals within the same company access the platform, they are collectively counted as a single user.
Methodology
Loans below $50,000 and above $5,000,000 have been removed from the data set.
Loans with interest rates below 4% and above 20% have been removed from the data set.
For the loan volume slides, the user must have signed up with Lightning Docs prior to 2025.
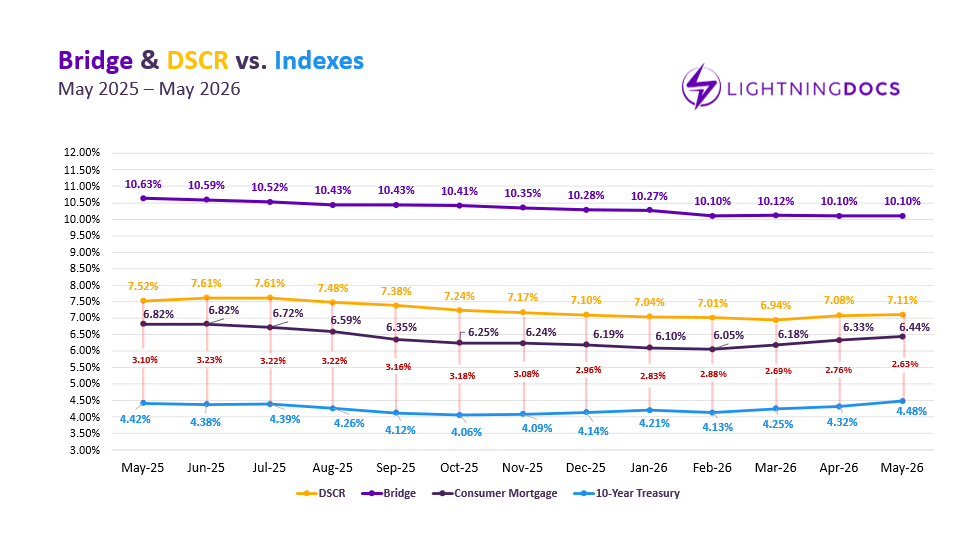
May reflected continued normalization in broader lending markets as rising 10-Year Treasury yields and consumer mortgage rates disrupted the long decline of bridge and DSCR interest rates. Even so, underlying demand for private lending remained strong, with both bridge and DSCR activity demonstrating resilience and, in one key respect, record-breaking efficiency.
While total monthly volume decreased slightly from April levels, May delivered the highest loans per business day on record for our platform. With only 20 business days last month, activity concentration reached an all-time high, demonstrating that demand for private loans did not weaken: rather, activity was compressed into a shorter operating window.
Across both bridge and DSCR lending, more than 6,500 loans were closed in May, underscoring continued strength in investor and development financing channels even as rate conditions shifted.
Macroeconomic conditions remained an important backdrop. The 10-year Treasury rose to 4.48%, its highest level since January 2025, while consumer mortgage rates increased to 6.44%, their highest level since August 2025. DSCR rates increased for the second consecutive month, up 3 basis points to 7.11%, while bridge rates at 10.10% sustained the relatively flat pricing experienced since February. Despite two consecutive increases to average DSCR interest rates, the spread between them and 10-year Treasury yields tightened to 2.63%, the smallest margin recorded since we began tracking rates in January 2024. The demand for DSCR loans remains, it appears, at record highs.
Bridge Loan Activity
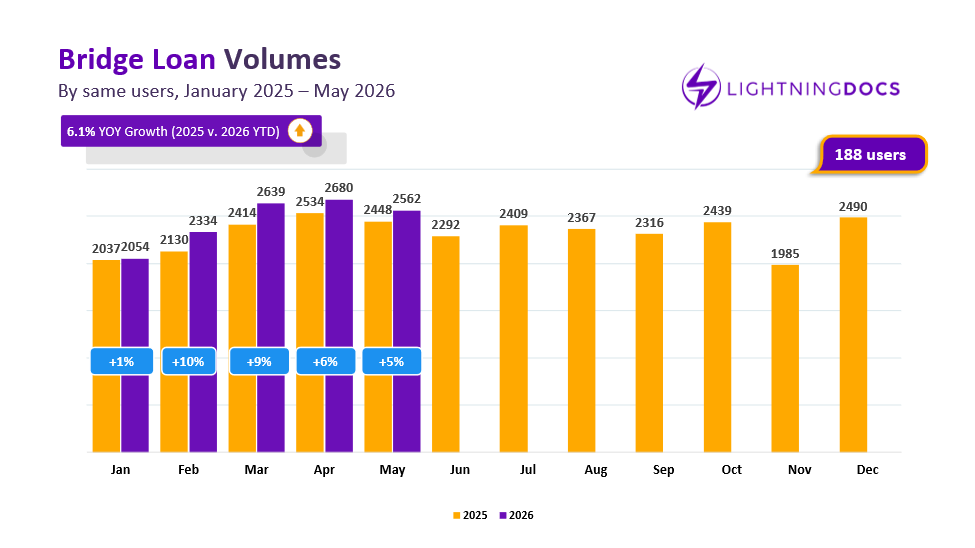
Bridge lending remained steady in May, with 3,156 total loans originated through the platform. While this reflects a modest decline from April’s elevated total, adjusting for fewer business days shows that volume remained on pace with April.
Among lenders active since the beginning of 2025, bridge loan volume reached 2,562 in May versus 2,448 in May 2025, representing a modest but consistent 5% year-over-year growth across same-store sales. On a per business day basis, bridge lending reached its highest level on record, highlighting sustained demand even in a shorter operating month.
According to data provider Elementix, querying Q1 2025 bridge volumes across all private lenders resulted in a total of a -1% YoY comparison between Q1 2025 (34,390 total loans) and Q1 2026 (34,501 total loans). As such, Lightning Docs users appear to be outperforming the market average by growing in an environment where volume has collectively stagnated industry-wide.
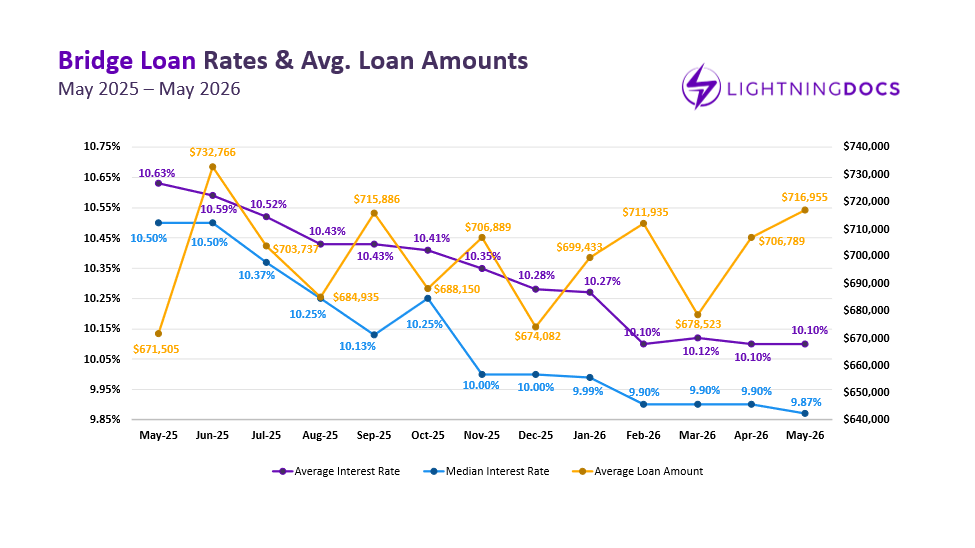
Average bridge loan rates held flat at 10.10% from April to May. Since February, bridge rates have remained remarkably stable even as broader market rates have continued to move higher. At $716,955, the average bridge loan amount is the second highest of the past 12 months, though is still within the normal range we’ve seen. Ultimately, the past 4 months have been remarkably stable despite the macro-economic environment seeming anything but.
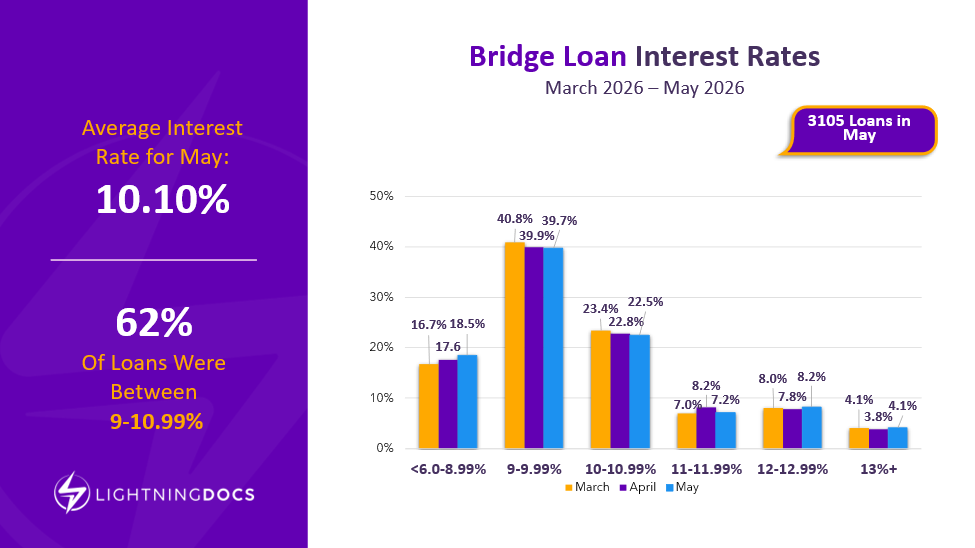
Although average bridge loan rates have remained relatively flat in recent months, the rate distribution has become more dispersed. The majority of bridge loans continue to fall within the traditional 9% to 11% range, but activity has recently increased at both ends of the market. Loans below 9% have gained share in recent months, while originations above 12% have also increased.
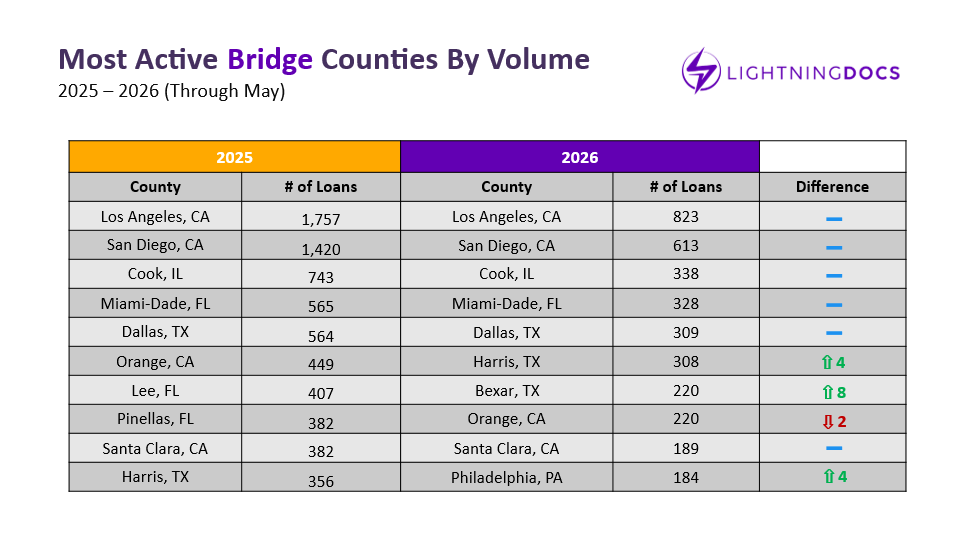
From a geographic perspective, Washington continued its standout performance, overtaking Illinois in the annual rankings after another strong month of growth. Washington has now posted month over month increases in every month of 2026, making it one of the most consistent growth markets in the country. Colorado (16th) and Arizona (19th) are two markets outside of the top 10 which have also increased volume each month of 2026.

At the county level, Santa Clara County’s (San Jose, CA) strong performance pushed it into the top ten annual markets, while Pinellas County (St. Petersburg, FL) fell out of the rankings. Maricopa County (Phoenix, AZ) and Clark County (Vancouver, WA) both posted top ten monthly volumes in May but remain outside the top ten year to date.
DSCR Loan Activity
DSCR lending remained the largest and most dynamic segment on Lightning Docs. However, May marked the second consecutive month of volume moderation as interest rates continue to rise, resulting in the most significant decline of year-over-year increases this year as market conditions become increasingly more difficult.
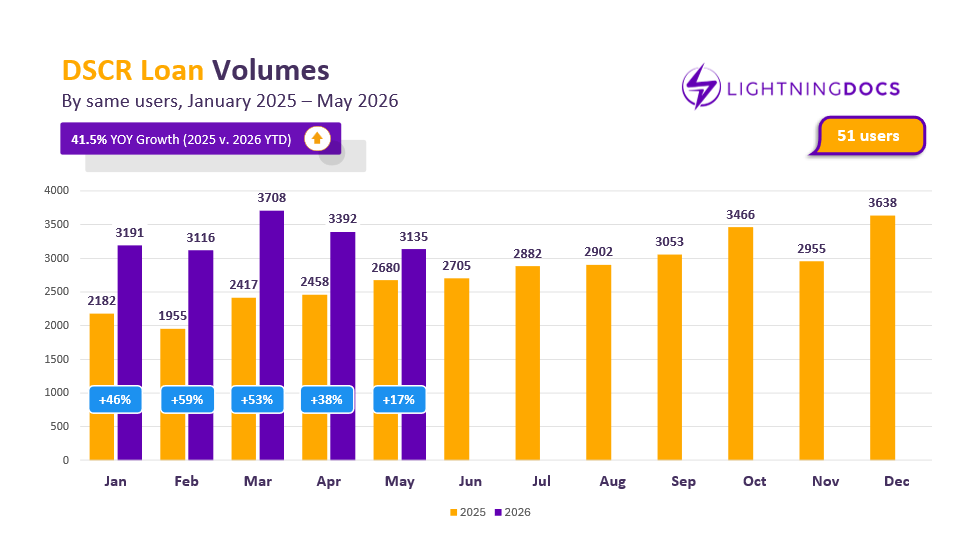
A total of 3,404 DSCR loans were originated in May. Among lenders active since the beginning of 2025, volume reached 3,135 compared to 2,680 in May of last year, representing 17% year-over-year growth in same-store sales. This indicates a significant deceleration from earlier this year, in which DSCR volumes were increasing 40-60% year-over-year each month.
When reviewing Elementix data and querying private lenders’ DSCR volumes, the data shows a comparatively more modest 4.5% increase from Q1 2025 (11,181) to Q1 2026 (11,686). Running the same volume query in Elementix and instead filtering for conventional and Non-QM mortgage bankers results in an astonishing 70% YoY growth from Q1 2025 (24,400) to Q1 2026 (41,307).
Lightning Docs DSCR users are comprised of both private lenders and Non-QM/conventional mortgage bankers, with a total aggregate volume of 10,554 loans in Q1 2026 (approximately 20% of all DSCR volumes by both cohorts). These results confirm that while private lending DSCR growth has been tepid, Non-QM and conventional mortgage bankers have been dramatically increasing their DSCR production.
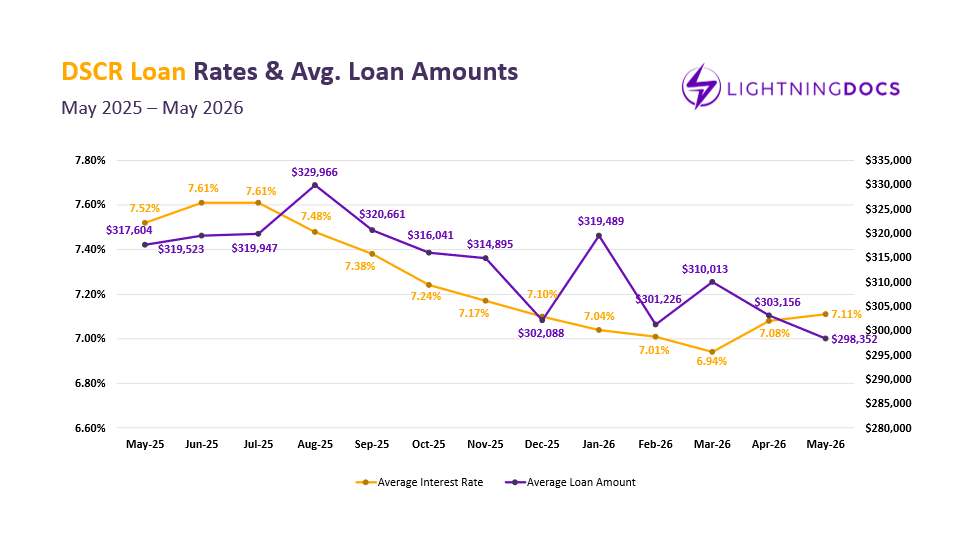
Average DSCR interest rates increased by 3 basis points to 7.11 percent, marking the second consecutive monthly increase following a longer period of downward pressure earlier in the year. This reflects a gradual adjustment to broader market conditions, including higher Treasury yields and shifting expectations around inflation and growth.
At the same time, average loan amounts for DSCR fell below $300,000 in May for the first time since February 2025. The decline in average loan amounts coincides with a period of year-over-year declines in average rental prices nationwide.
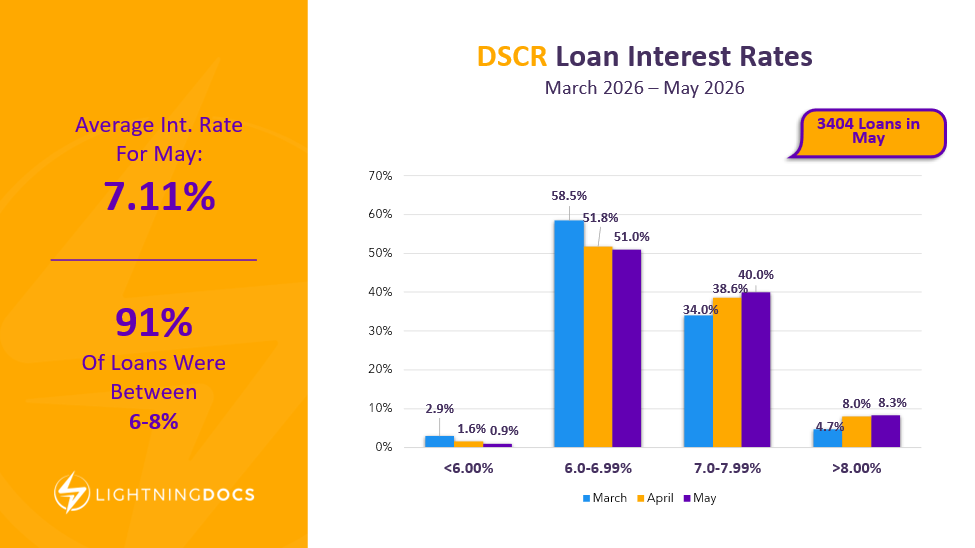
As DSCR interest rates have moved higher over the past couple of months, the market has shifted noticeably into higher rate bands. Loan volume has migrated from the 6.00% to 6.99% range into the 7.00% to 7.99% range, reflecting the gradual increase in financing costs seen throughout the spring.
The sub-6% segment that emerged earlier this year has largely disappeared and now accounts for less than 1% of all DSCR originations. At the same time, loans priced above 8% have nearly doubled since March, further illustrating the market’s adjustment to a higher-rate environment.
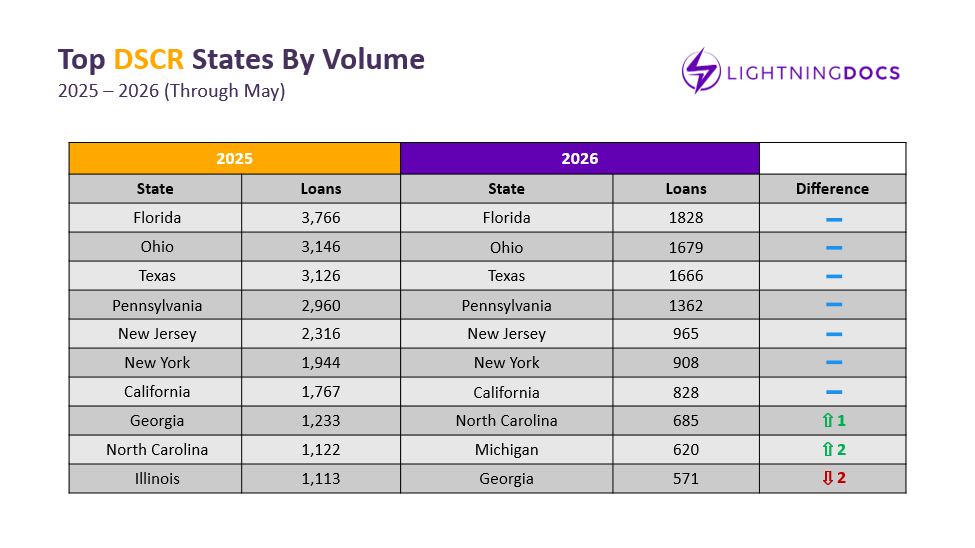
Top DSCR states remained unchanged in May, signaling continued stability at the top of the market rankings. Missouri once again posted top ten monthly volume and now sits just one loan outside the top ten year to date. Maryland continues to cool after a strong start to the year, while Illinois has yet to generate consistent enough volume in 2026 to break into the top tier.
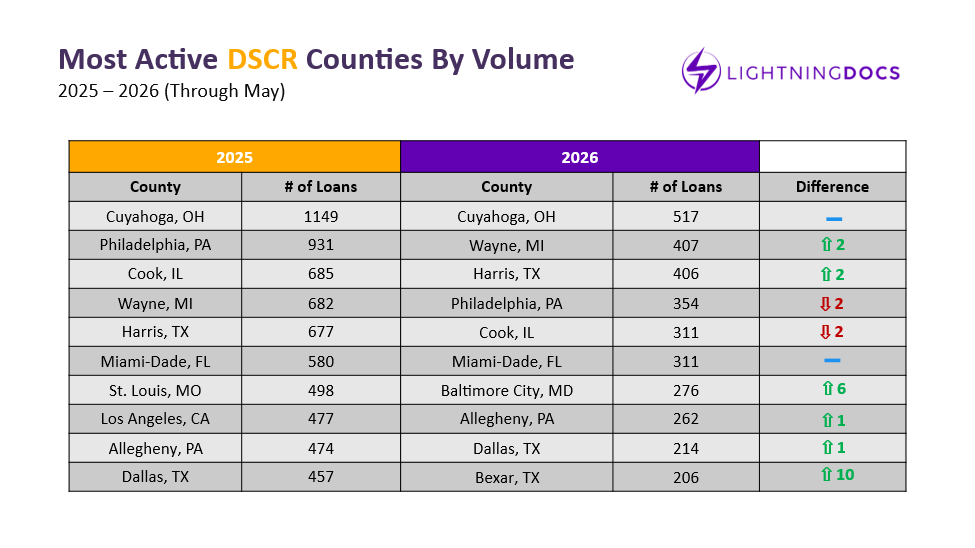
At the county level, Wayne County, Michigan (Detroit) continued its strong upward trajectory, moving into the number two position nationally. Baltimore City, Maryland saw a notable decline, now down nearly 68 percent from its January peak. Jackson County, Missouri (Kansas City) and Los Angeles County, California both posted top ten monthly performance in May but remain outside the year to date top ten.
Looking Ahead
While broader financial markets have experienced modest rate volatility, private lending activity continues to demonstrate consistent underlying demand.
May is best understood not as a slowdown in activity, but as a month of compressed execution. Despite fewer business days, a record 328 loan document packages were created per business day in May, while year-over-year growth remained firmly positive in both product segments.
As rates stabilize at higher levels, the market continues to reflect gradual normalization rather than contraction, where volume adjusts month to month but structural demand for private lending remains intact. Looking ahead, recall that volumes typically plateau for the remainder of Q2 and Q3 in anticipation of significant growth in Q4. But with market conditions that are anything but routine, there may be surprises in store as the industry pushes further into the year.