Each month when I write the Lightning Docs Private Lending Market Report, one trend remains consistent: California, Florida, and Texas continue to dominate bridge lending. For DSCR loans, Florida and Texas lead the way, with California also holding a spot in the top 10.
Rather than simply noting this in the national report, this month I wanted to take a closer look at what’s happening within these three key states and how their trends are shaping the broader private lending market.
National Context
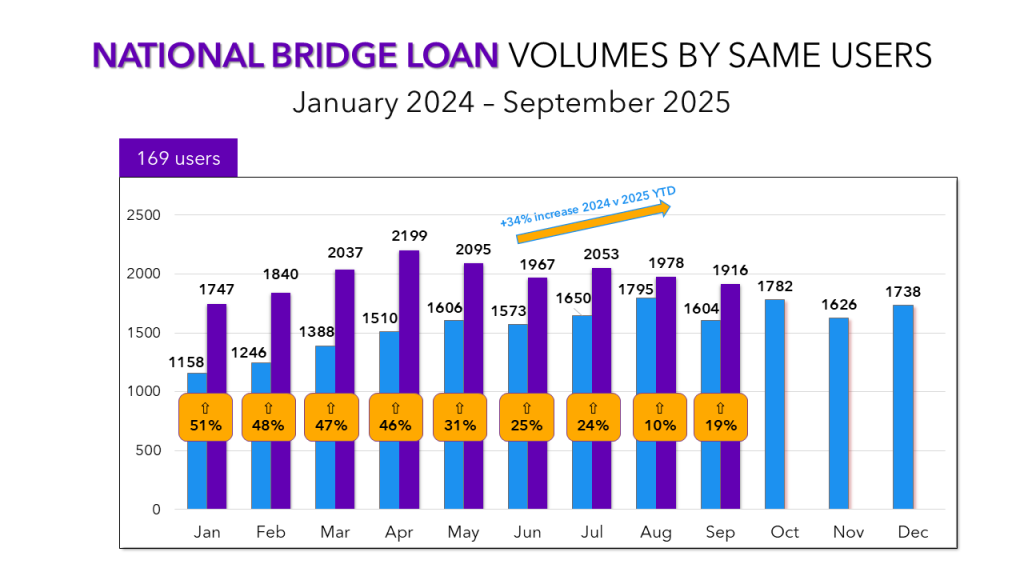
Across the country, bridge loan activity has plateaued in 2025 after an extended period of steady growth. But to understand what’s behind that slowdown, it’s important to look at the markets driving the bulk of lending volume.
California
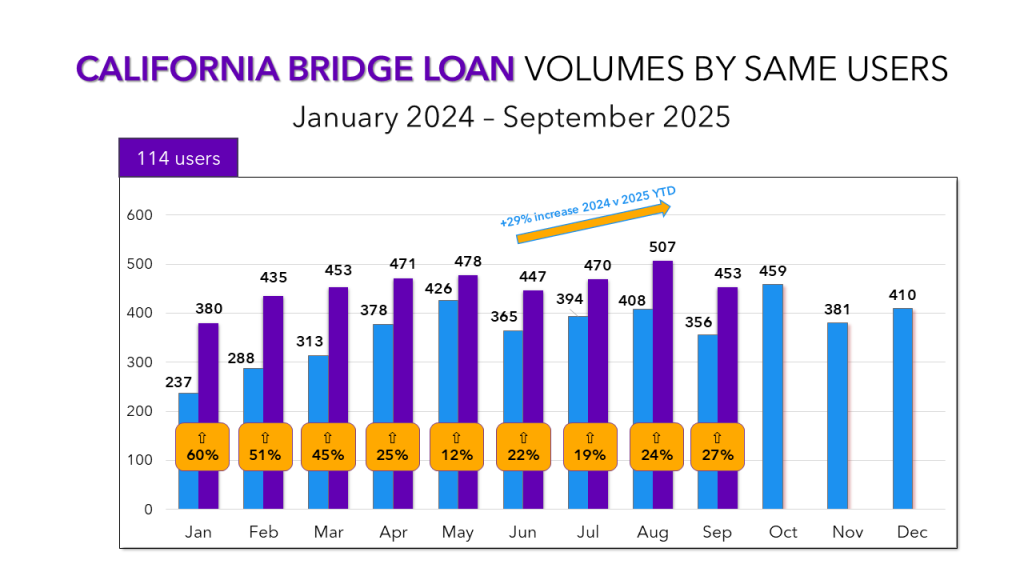
California, by far the biggest state for bridge loans on Lightning Docs, seems to be keeping slightly ahead of the national growth trends. In August, California reached a record high for bridge loan transactions with 507 loans, representing over a quarter of all bridge loans on the system for users active since the start of 2024. September saw some regression to 453 loans, and overall trends are showing growth slowing similar to what we’re seeing nationally.
Florida
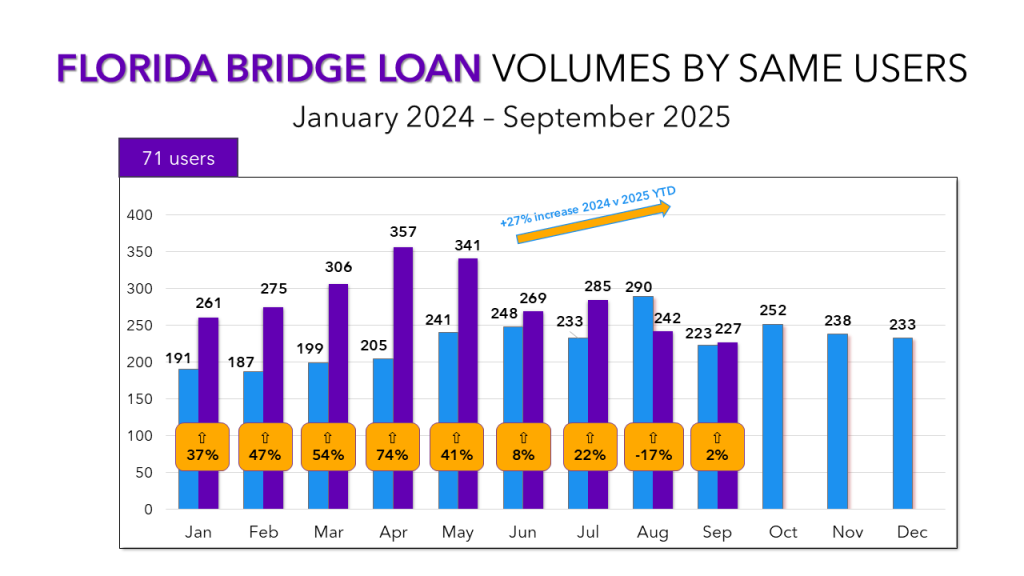
Florida saw its strongest month of 2025 back in April, but since then, volume has fallen more sharply than the national average. In August, the number of bridge loans was actually a 17% decrease from the year prior. There have been rumblings of uncertainty in Florida for a while specifically around dramatic rising costs of insurance and concerns of declining home price values particularly in markets that dramatically appreciated during and after the pandemic.
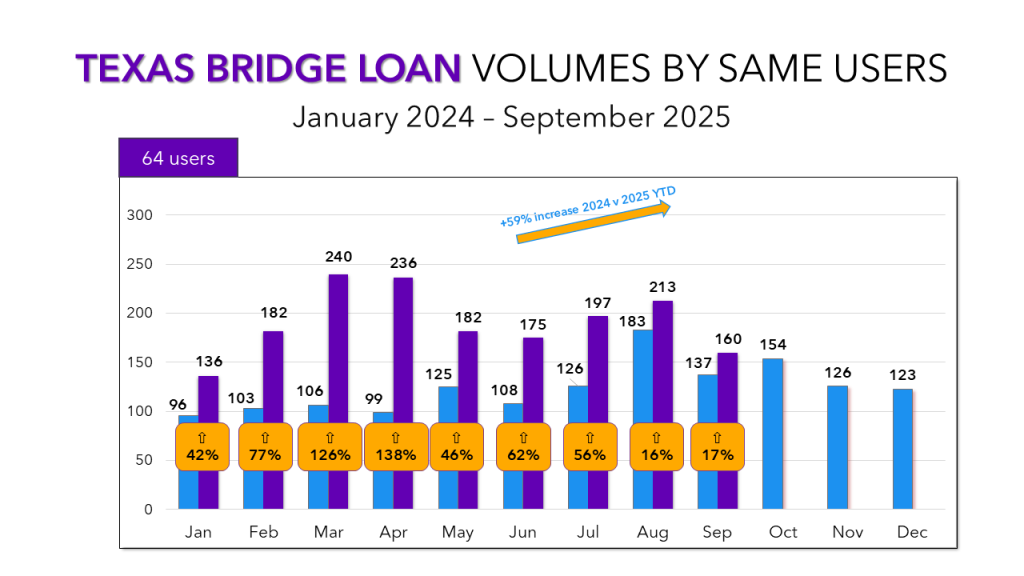
Texas
Texas started 2025 the strongest of these states, recording months with 126% and 138% year-over-year growth. But since May, that momentum has cooled, with only one month surpassing 200 bridge loans.
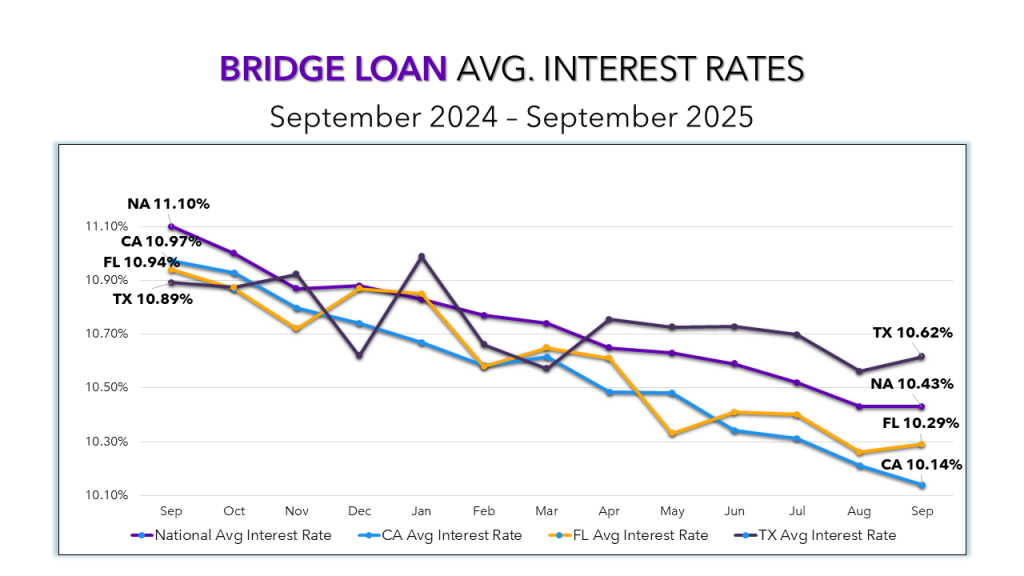
Interest Rate Trends
Over the past 12 months, all three states have tracked closely with national interest rate movements. One year ago, their average bridge loan rates sat below the national average of 11.10%. Since then, rates have generally declined across the board. Texas, due to several months of upward spikes, has seen the smallest drop—just 27 basis points—while Florida and California posted larger decreases of 65 and 83 basis points, respectively.
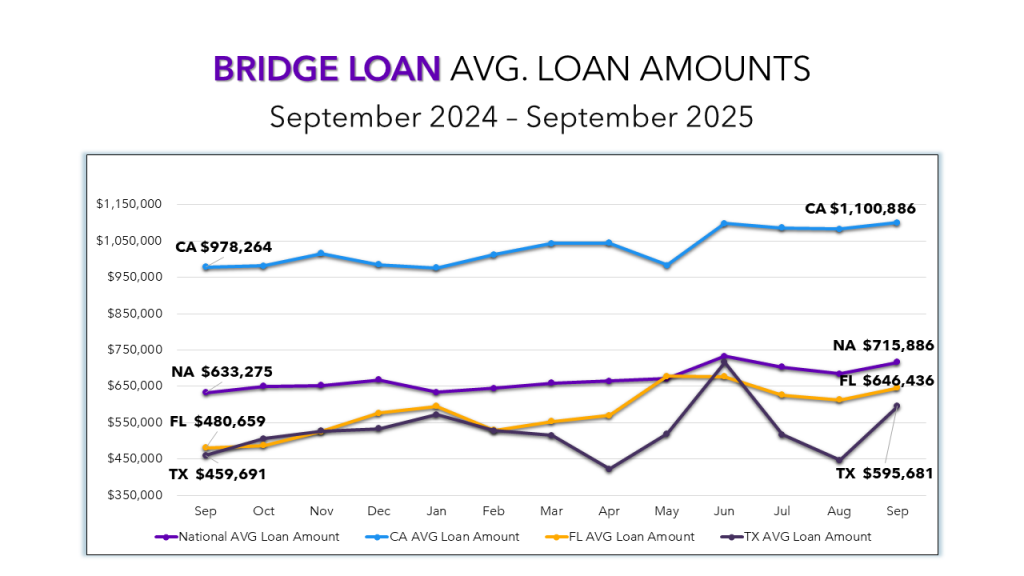
Rising Loan Amounts
When it comes to average loan amounts, California continues to stand out with the highest bridge loan amounts in the country, though its growth over the past 12 months has been roughly in line with the national average (12.5% vs. 13%). Florida and Texas, while posting lower average loan amounts than California, have experienced much faster growth over the same period — 34% and 30%, respectively. It is likely lenders in those markets are forced into more aggressive loan to value ratios than before, as home price values are not appreciating at a similar rate.
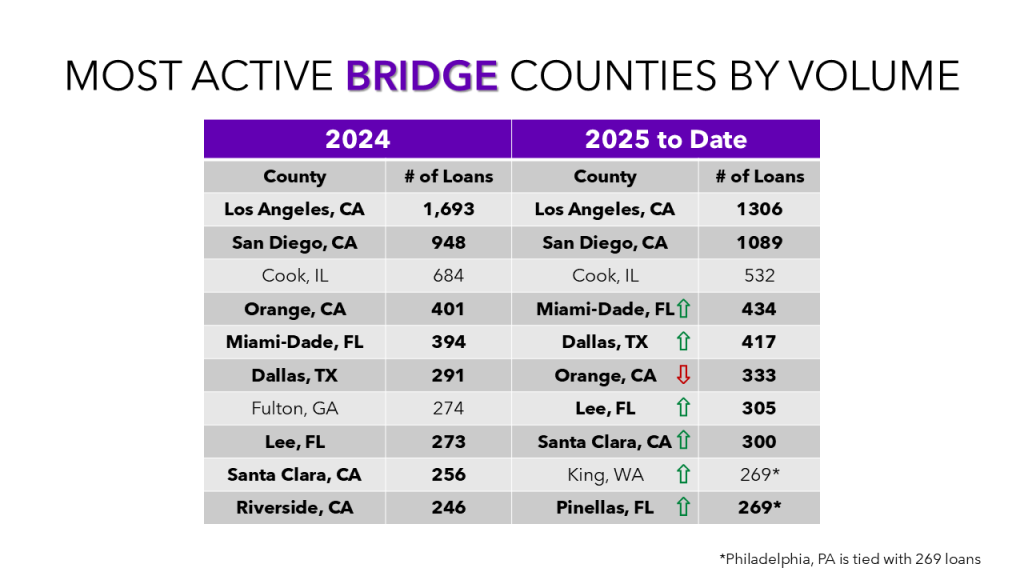
If you read my national reports, you’re familiar with this data, but it really drives home how important these markets are to bridge loans. Eight of the nation’s most active bridge loan markets are in California, Florida, or Texas, and the concentration runs deeper: 29 of the top 50 counties are located in these three states.
With the vast majority of Lightning Docs users active in one or more of these states, I hope this closer look has provided additional clarity on what’s driving today’s bridge lending market.
If you’d like to see a deeper dive into each county within these states, click the link below to get that data and all of the slides covered above delivered directly to your inbox.