Bridge Interest Rates Break Below 10% as DSCR Regains Record Volume
Nema Daghbandan, CEO
July brought two milestones to private lending on Lightning Docs. Bridge loan interest rates dropped below 10% for the first time since June 2022, even as bridge volume cooled from June’s record pace. At the same time, DSCR lending set an all-time high for monthly transactions on the platform, even as year-over-year growth among the longest-tracked users continued to slow.
Taken together, the data paints a picture of a market where borrower demand remains resilient, competition continues to pressure pricing, and capital availability appears healthy across both bridge and DSCR lending. Let’s break down what the numbers show across volume, rates, and geography, and what they likely mean for lenders and investors trying to plan ahead.
Want the Full Picture?
The trends in this article are just a snapshot. The complete Lightning Docs Private Lending Market Report includes deeper, market-by-market detail for private lending professionals:
- Expanded Regional Breakdowns: State and metro-level data beyond the national averages shown in this article
- Above-Average Rate Markets: See exactly which regions are commanding higher interest rates, and why
- Above-Average Loan Amount Markets: Identify where deal sizes are outpacing the national norm
- Volume Heat Maps: Visualize lending activity concentration across the country at a glance
How Much Did Bridge Loan Volume Grow in July?
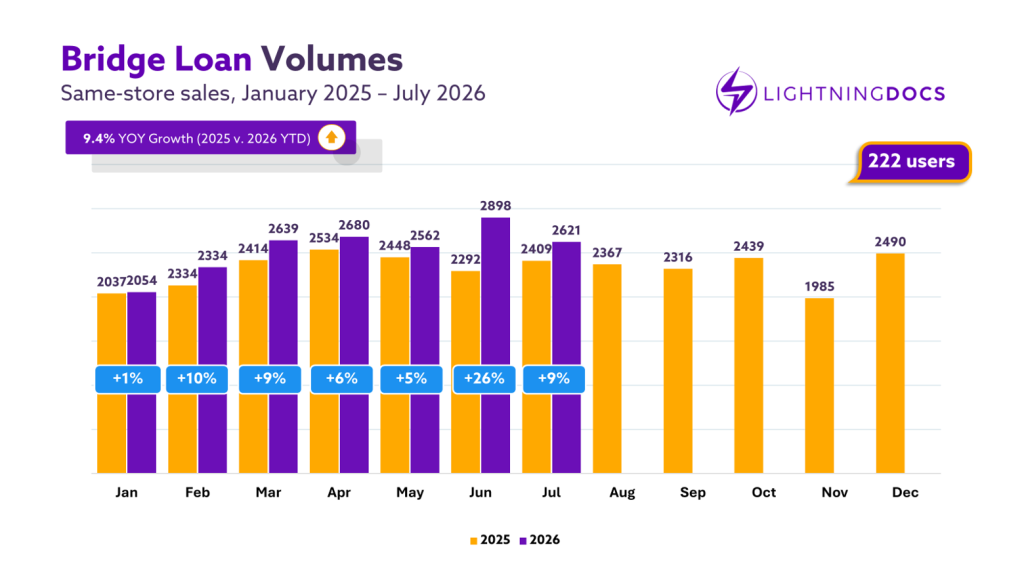
Bridge loan volume came down from June’s record pace, with 2,621 transactions closed in July. Even so, that’s 9% growth year-over-year from July 2025, showing the segment is still on a healthy growth trajectory rather than losing steam. However, it seems that June should be regarded as an exception to the more typical trend we have been seeing of high single-digit YoY growth.
What Happened to Bridge Loan Interest Rates in July?
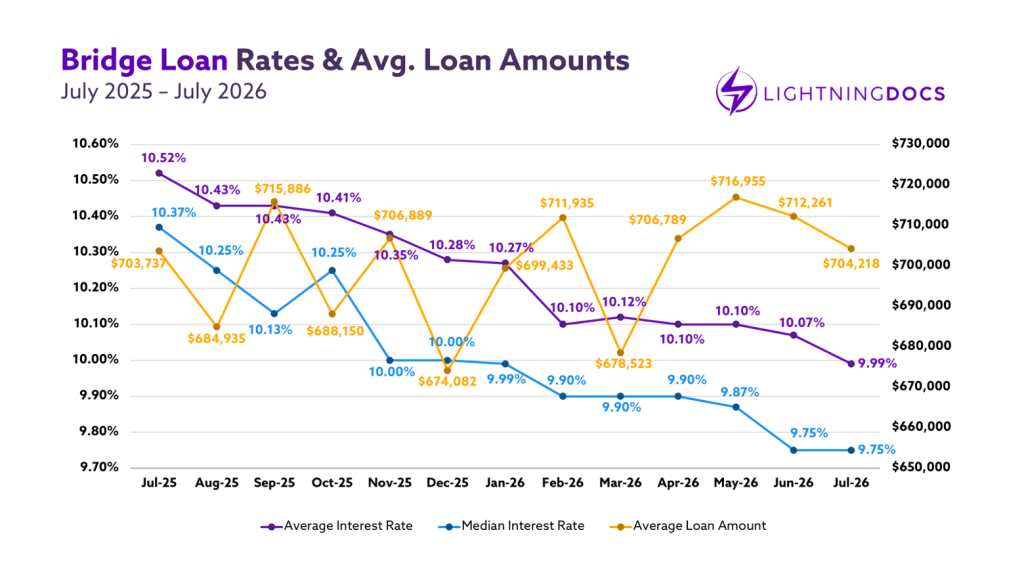
National average bridge loan interest rates fell 9 basis points in July to 9.99%, marking the first time bridge rates have broken below 10% since June 2022. The median interest rate held steady at 9.75%. Average loan amounts also decreased, down about $12,000 for the month. At $704,000, the average is approaching its first drop below $700,000 since March.
Is Bridge Loan Pricing Shifting Toward the Middle?
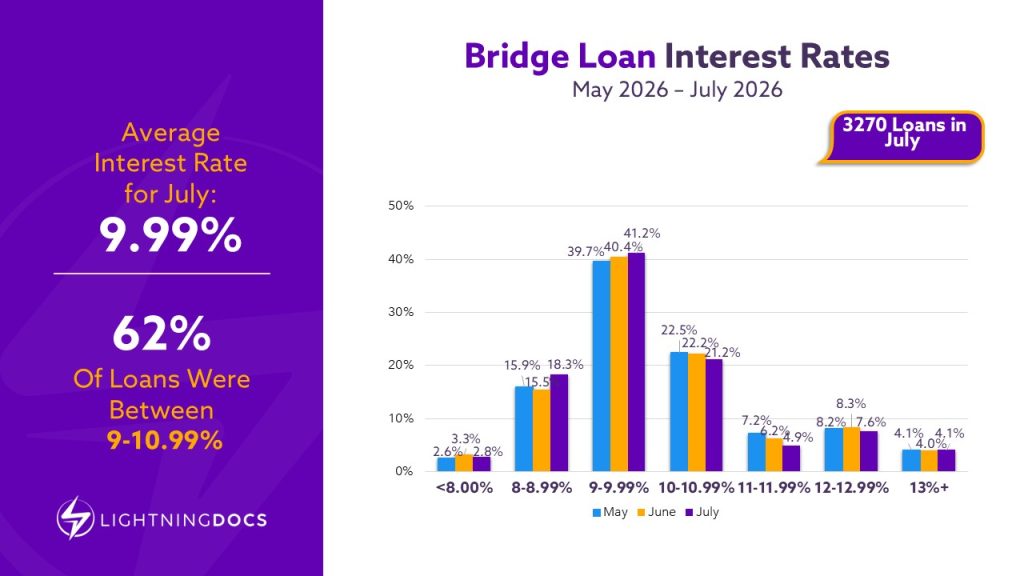
Despite the drop in average rate, the share of loans priced below 8% actually decreased slightly in July. The larger movement was in the 8-8.99% band, which showed the most significant growth of any segment. This points to pricing consolidation around the middle of the market, where many lenders appear most comfortable deploying capital. Regardless, it’s astounding that almost 20% of more than 3,000 loans are now priced somewhere between 8-8.99%.
Which States are Leading Bridge Lending Competition?
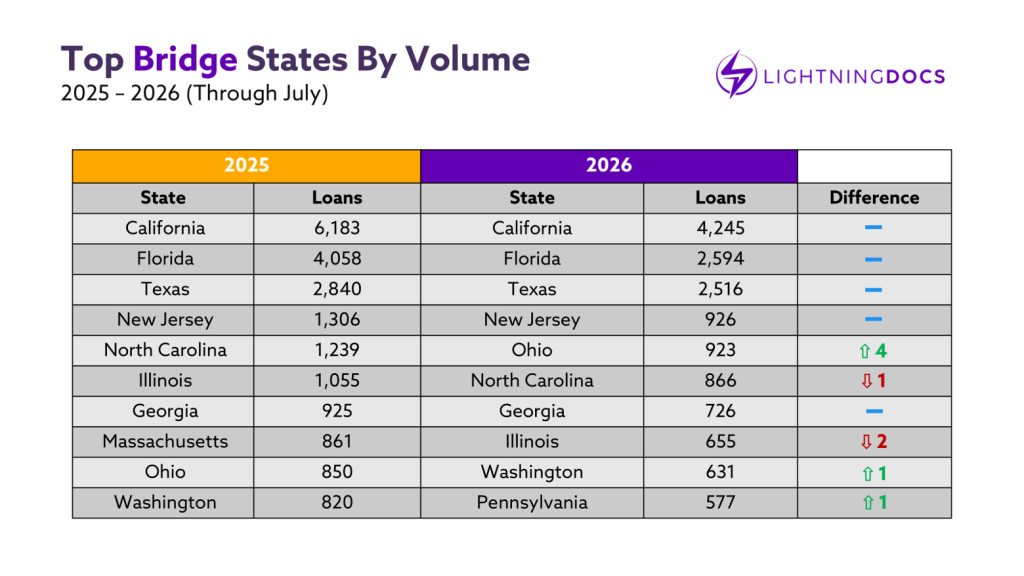
The top 10 states for bridge lending remained largely unchanged in July. New York and Massachusetts both posted top-10 volume for the month and continue to edge closer to cracking the top 10 for the year overall. Outside of those two, Illinois and Oregon were the only other states in the top 15 to post their highest volume month of the year in July. Washington was a different story. After showing strong momentum through the first half of the year, the state has now seen volume decline in each of the past two months.
Which Counties are Driving Bridge Loan Volume?
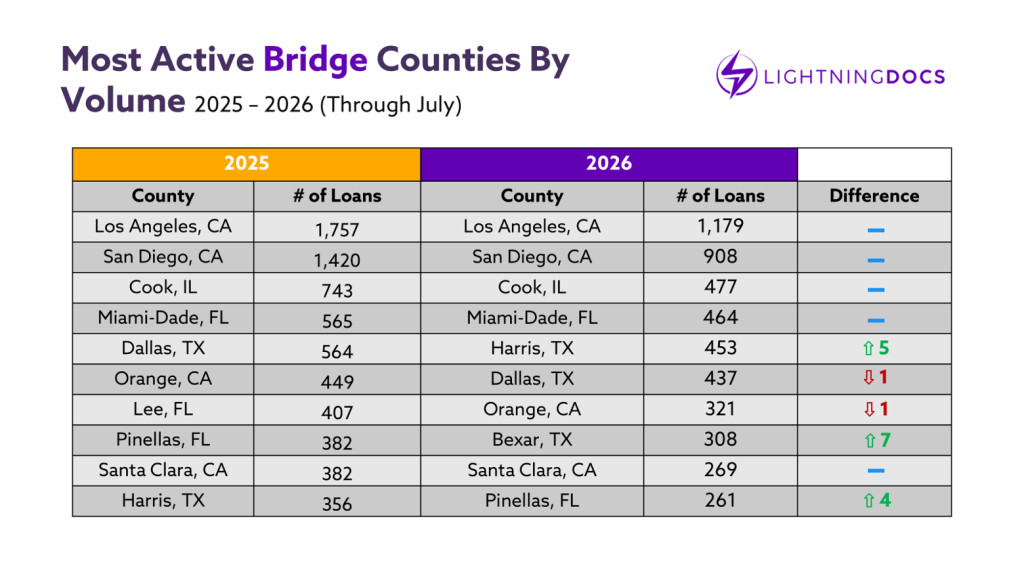
The annual top-10 county rankings remained unchanged, but monthly performance highlighted several noteworthy developments.
Los Angeles retained the top spot, though San Diego came within just 18 loans of overtaking it, underscoring the continued strength of California’s bridge market.
Mecklenburg County, North Carolina (Charlotte), emerged as one of the month’s most notable growth stories. The county recorded 38 bridge loans in July, its highest monthly total of the year and enough to place it among the top 10 counties nationally.
What Happened to DSCR Lending Volume in July?
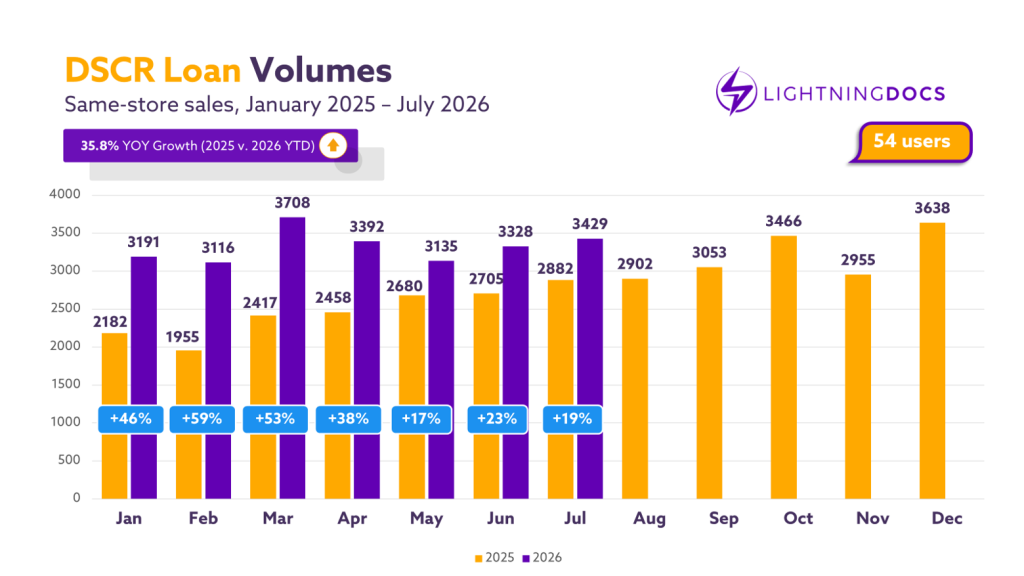
Among users who have been on Lightning Docs since the start of 2025, DSCR volume grew 18% year-over-year in July. That’s down from the highs seen earlier this year, but still a strong growth rate. Expanding to look at all Lightning Docs users, they combined to close 4,340 DSCR transactions in July, an all-time high for the platform.
How DSCR Rates and Loan Amounts Moved in July
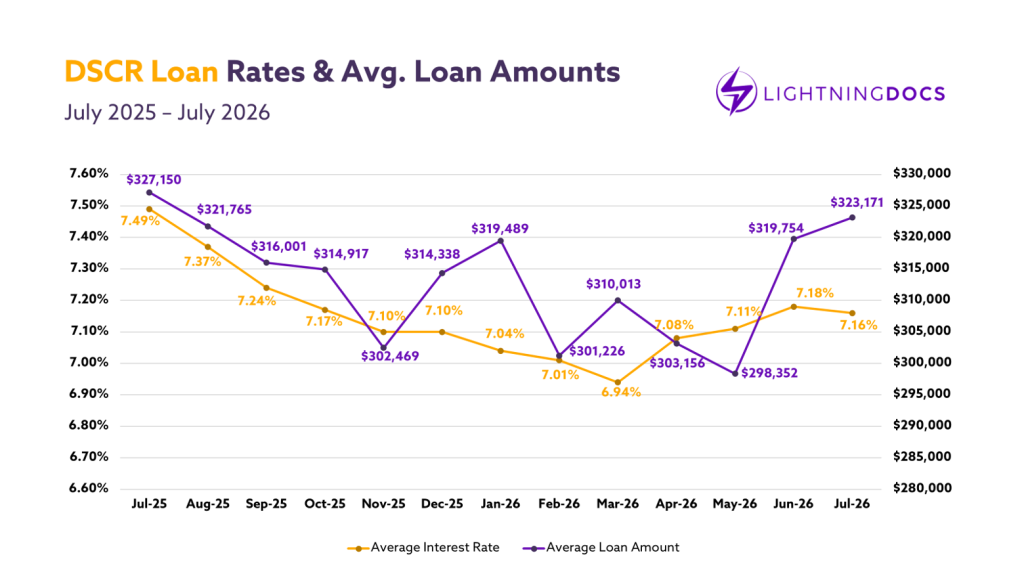
Average DSCR loan amounts increased about $3,000 in July, to $323,000. That’s the highest average since July 2025, which was also the month loan amounts peaked last year. Average interest rates for DSCR loans dropped 2 basis points to 7.16%, the first decline after three consecutive monthly increases.
How is the DSCR Rate Distribution Shifting?
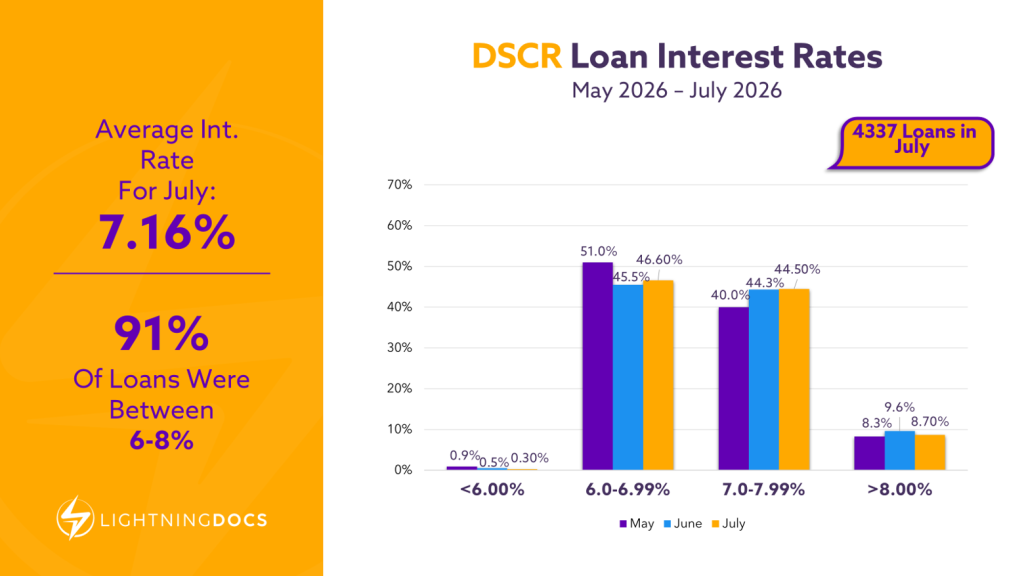
DSCR rate distribution concentrated toward the mean in July. Both the 6-6.99% and 7-7.99% bands increased their share of volume, while loans priced above 8% decreased and loans below 6% were virtually non-existent.
How are Bridge and DSCR Rates Responding to Benchmark Rates?
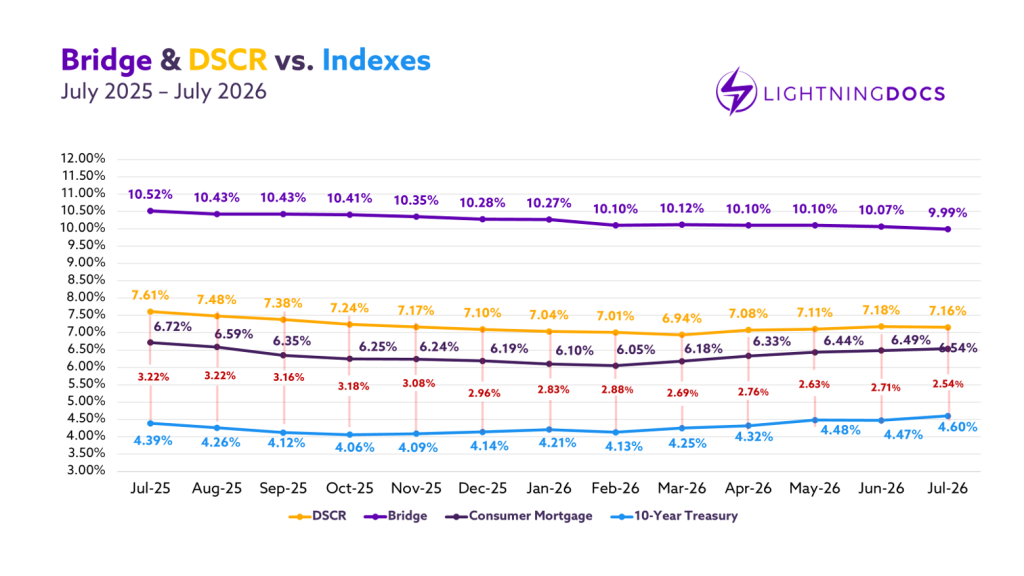
After a slight decrease in June, the 10-year Treasury yield increased 13 basis points in July to 4.60%. Combined with the drop in DSCR rates, that tightened the spread between the two to 2.54%, a historically tight spread. Paired with the increase in overall DSCR transaction volume, the narrow spread suggests that demand for the product remains as strong as ever.
Consumer mortgage rates continued their own upward climb, rising for a fifth consecutive month to 6.54%, the highest level since August of last year. What is remarkable is that DSCR rates in July were only 62 bps higher than consumer mortgage loans, comprising the narrowest spread between consumer mortgage loans and DSCR loans recorded in the trailing twelve month period. The average spread between consumer loans and DSCR loans over the past year has hovered at 85 bps, with historical averages closer to 100 bps. This number has precipitously declined since.
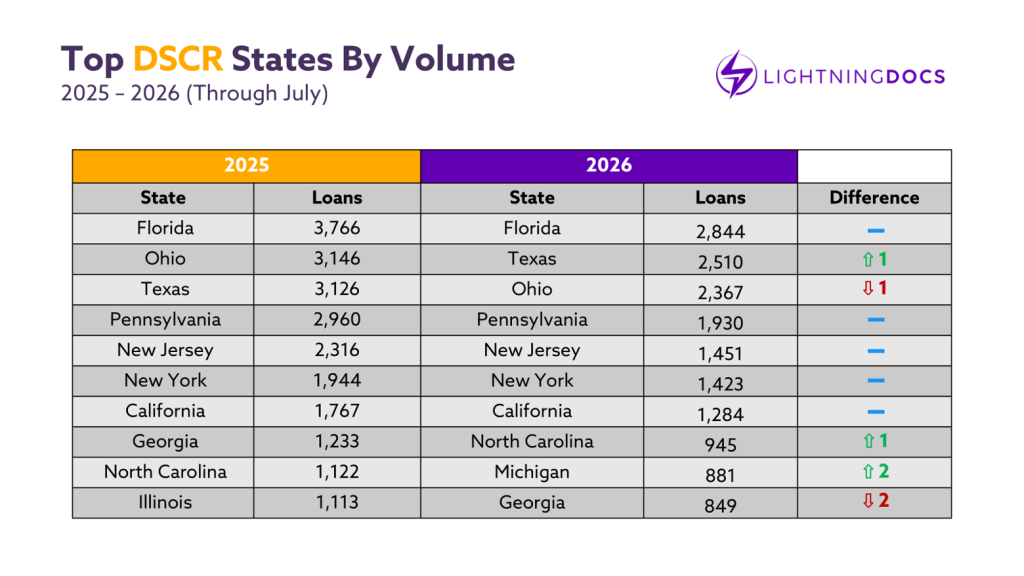
Which States are Leading DSCR Lending?
July brought no changes to the top 10 states for DSCR lending. Within that group, Texas, New Jersey, New York, California, Michigan, and Georgia all posted their highest output of the year in July. Just outside the top 10, Tennessee and Virginia are showing strong momentum, while Maryland has cooled off significantly over the course of the year.
Which Counties are Leading DSCR Lending?
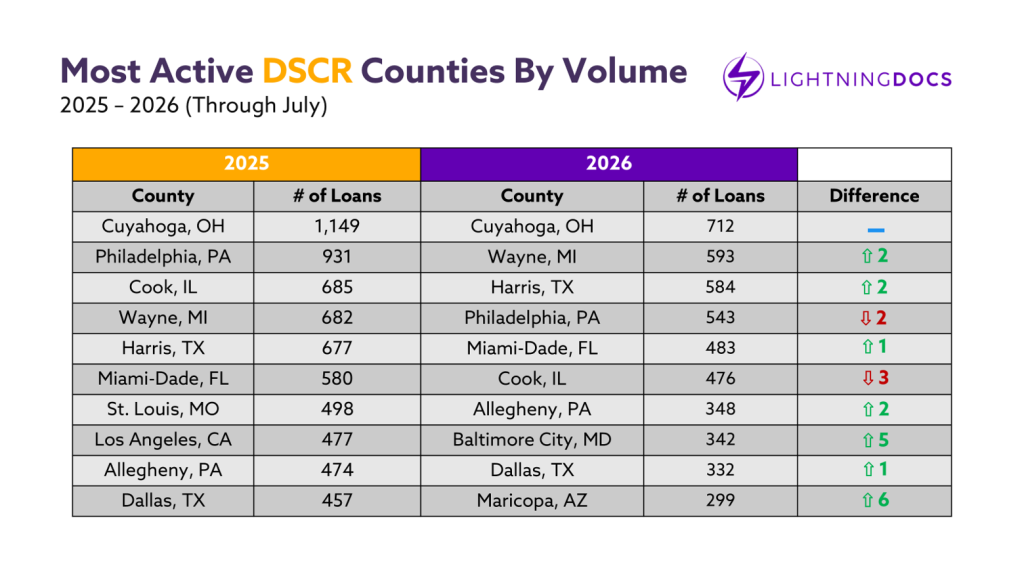
The top 10 counties for DSCR lending held steady for the year in July. For the month itself, Harris, Texas (Houston) posted the highest volume of any county in the country. St. Louis, Missouri and Shelby, Tennessee (Memphis) both posted top-10 volume in July, and both rank in the top 20 for the year overall. Baltimore City, Maryland, which drove the state’s hot start to the year, has seen its monthly volume drop significantly since Q1.
July’s Private Lending Takeaways: What Does the Data Mean for Lenders and Investors?
July’s data points provide one clear takeaway: demand for investor loan products remains strong across both product segments. Bridge lending held onto healthy year-over-year growth even as volume cooled from June’s record, and DSCR lending posted an all-time high for monthly transactions even as growth among the longest-tracked users continued to slow. What stands out most is the rate picture. Both bridge and DSCR interest rates moved lower in July, even as the 10-year Treasury yield and consumer mortgage rates kept climbing.
Definitions
A bridge loan is any loan with a duration of 36 months or less utilizing interest-only payments for the duration of the term and containing a balloon payment at the end of the loan. Bridge loans are commonly referred to as residential transition loans (RTL), fix-and-flip, non-owner occupied, hard money, or in other terms that describe a short-term loan generally secured by a residential property for investment purposes.
DSCR loans are 30-year term loans secured by rental properties. DSCR stands for Debt Service Coverage Ratio, which identifies that the primary underwriting for these loans is done by dividing the monthly net operating income of the property by the monthly debt service.
A User refers to a unique company using the Lightning Docs platform. If multiple individuals within the same company access the platform, they are collectively counted as a single user.
Methodology
Loans below $50,000 and above $5,000,000 have been removed from the data set.
Loans with interest rates below 4% and above 20% have been removed from the data set.
For the loan volume slides, the user must have signed up with Lightning Docs prior to 2025.
Related Content