Brace for Impact: Surge in 10-year Treasury Yields Shakes up Business-Purpose Lending

Nema Daghbandan, CEO
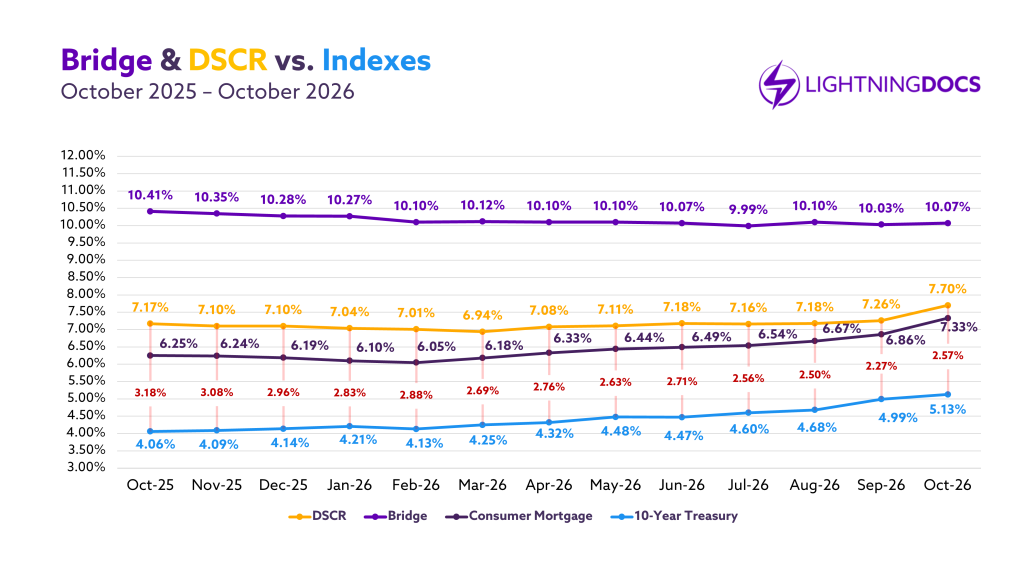
Back in September, the 10-year Treasury yield rose 31 basis points to 4.99%, the largest of six increases over seven months. October showed how private lending responded. DSCR interest rates jumped another massive 44 basis points to 7.70%. After holding relatively steady for months as Treasury yields climbed, DSCR lenders appear to have run out of room to keep tightening the spread between the two. Bridge loans were far less affected, with rates up just 4 basis points. Below, I’ll walk through how these rate changes affected transaction volume, loan amounts, and geographic trends, along with new market-wide data from our partnership with Elementix.
Want the Full Picture?
The trends in this article are just a snapshot. The complete Lightning Docs Private Lending Market Report includes deeper, market-by-market detail for private lending professionals:
- Expanded Regional Breakdowns: State and metro-level data beyond the national averages shown in this article
- Above-Average Rate Markets: See exactly which regions are commanding higher interest rates, and why
- Above-Average Loan Amount Markets: Identify where deal sizes are outpacing the national norm
- Volume Heat Maps: Visualize lending activity concentration across the country at a glance
NEW Market-Wide Data from Elementix
This month’s report includes data from Elementix, a provider of aggregated data on business-purpose lending, as part of a new partnership between our companies. Elementix covers the broader market, while Lightning Docs data reflects loans closed on our platform. Each company is publishing its own report, supplemented by the other’s data.
Looking at lender type, Elementix data through September shows multi-regional and national lenders growing year-over-year, while regional lenders are down only marginally and local lenders have declined sharply. What this signals to me is that the perceived market consolidation is actually happening. Specifically, National and Multi-Regional Lenders each have grown YoY at the expense of Local lenders.

Among the top 100 private lenders in the Elementix data, there is a nearly even split between those that have grown transaction volume year-over-year and those that have shrunk. So far in 2026, 53 have grown, 46 have declined, and one is exactly flat. Collectively, the top 100 private lenders are up 3.6% year-over-year, and because they account for 77% of the market, that figure is a meaningful benchmark. Over the same period, the 230 Lightning Docs users who have been with us since the start of 2025 grew a combined average of 20%, demonstrating that lenders who leverage efficient real estate technologies are far outperforming the market.

How Much Did Bridge Loan Volume Grow in October?
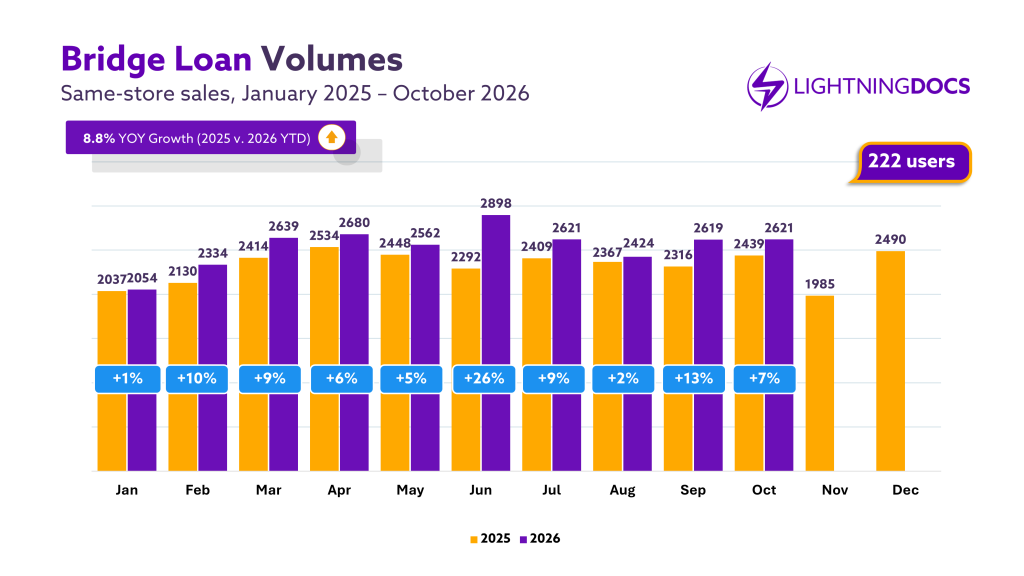
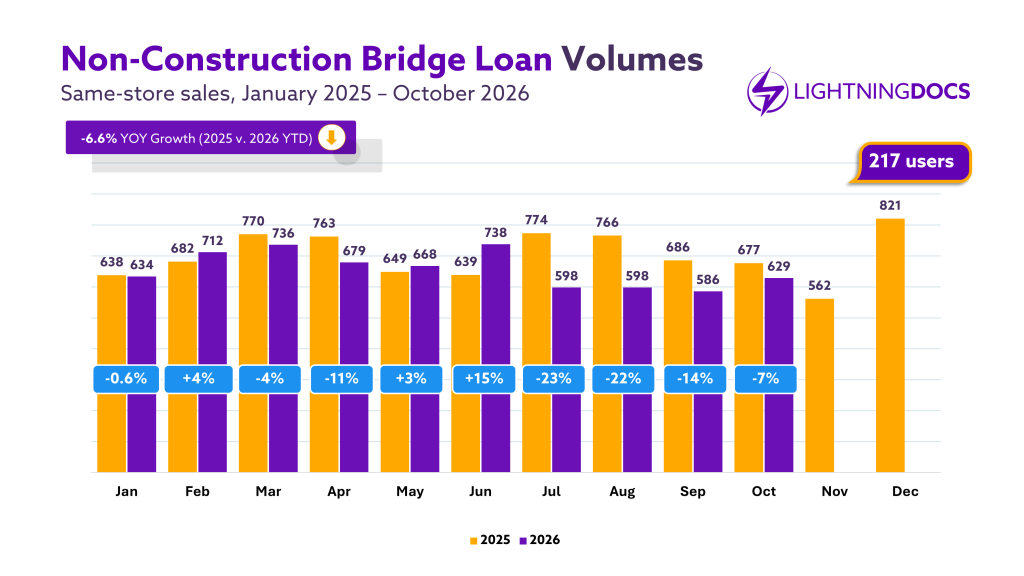
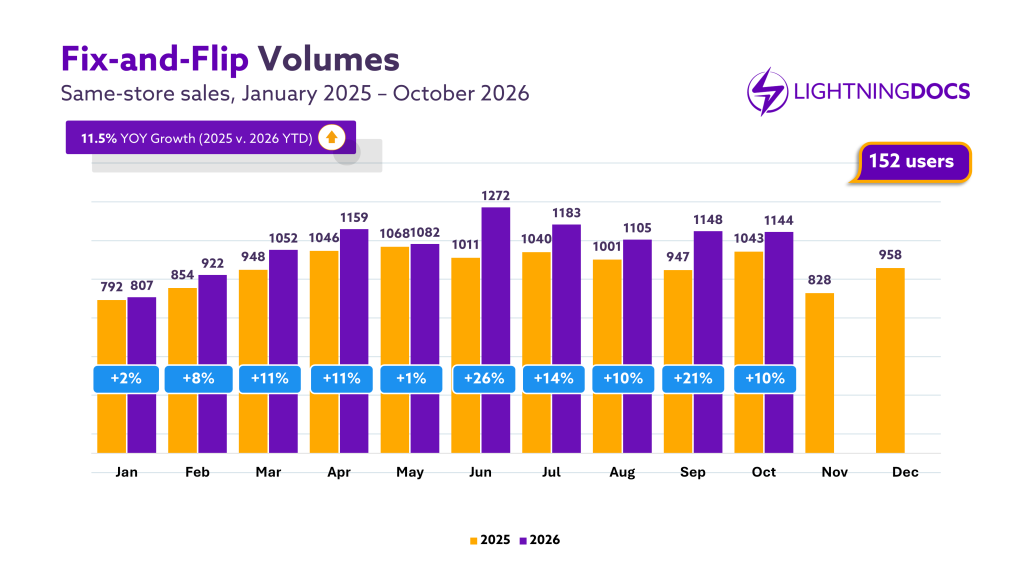
Among same-store users, bridge loan transactions were up 7% year-over-year in October, nearly keeping pace with year-to-date growth of 8.8%. As in previous months, overall bridge growth is driven by strong construction volume and steadily growing fix-and-flip activity, while non-construction bridge loans continue to decline year-over-year.

What Happened to Bridge Loan Interest Rates in October?
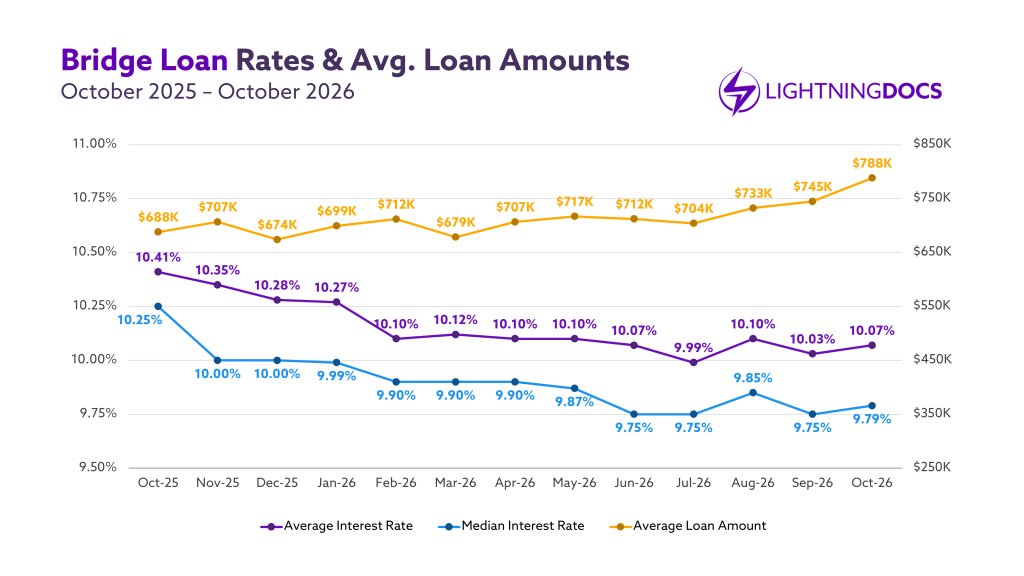
Bridge loan interest rates increased 4 basis points in October, to 10.07%. Despite broader macroeconomic volatility, this is only the third monthly increase in bridge rates this year.
Average loan amounts for bridge loans increased by $43,000 in October, to $788,000. That is the largest jump in the last 12 months, driven by higher loan amounts in 8 of the 10 states with the most transactions. Elementix data shows a similar trend: across the top 100 private lenders, average loan amounts rose from $545,660 in Q1–Q3 2025 to $597,193 in Q1–Q3 2026, excluding one outlier lender whose average exceeded $5M.
Which States and Counties Led Bridge Lending Through October?
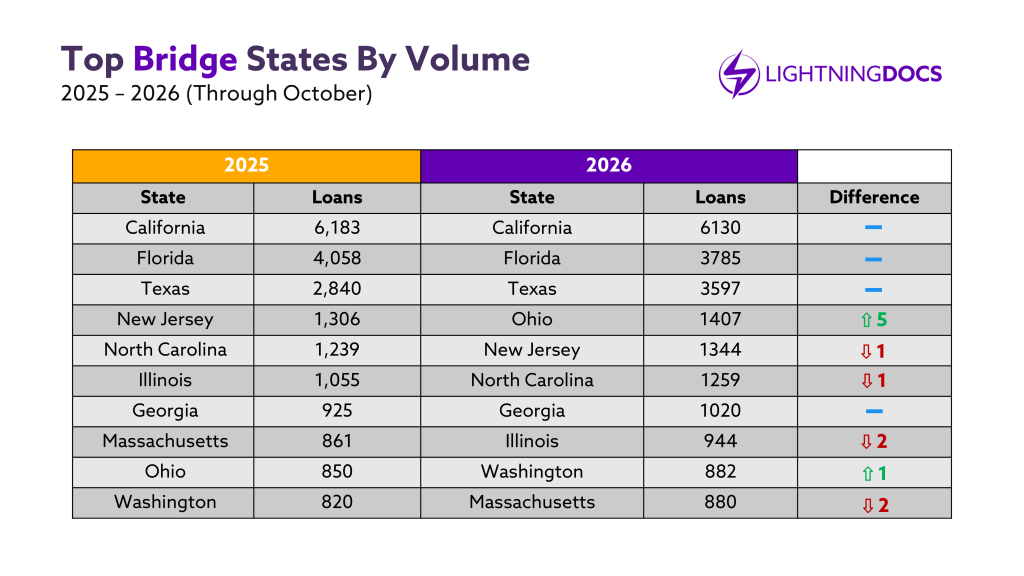
October was a strong month for the Northeast. Massachusetts and New York both had their strongest months of the year, with 124 and 112 bridge loans, respectively. New Jersey also finished above its recent pace with 156 loans. Elsewhere, Oregon rebounded from a weak September with its strongest month of the year, climbing 65% to 76 loans, and Tennessee matched that total for its own best month of the year, extending a steady climb that began in the spring. Texas, by contrast, softened to 339 loans, down 13% from September, though it held its place as the third-largest state for the year. Notably, the gap between Texas and Florida is much smaller in 2026 than it was in 2025, demonstrating the resilience of the Texas market and a softening in Florida.
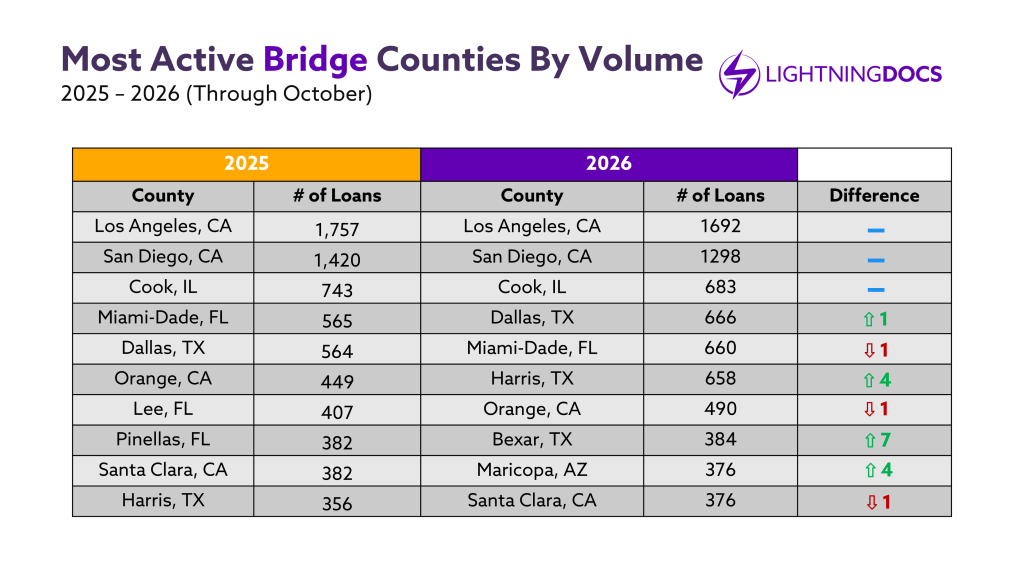
Orange County, CA (7th for the year) had its strongest month of 2026 with 63 loans, tying for 6th for the month. Maricopa, AZ, also had its strongest month with 50 loans, finishing 8th for the month and moving up from 12th to 9th for the year, replacing Pinellas, FL, in the top 10. Bexar, TX, one of the year’s top stories, went the other way, falling to 12 loans for its weakest month of 2026, down from 34 in September, and finishing 59th for the month. Franklin, OH (22nd for the year) was the only county outside the annual top 10 to finish in the top 10 for the month, tying for 9th with 40 loans, its best month of the year.
How Did DSCR Lending Volume Grow in October?
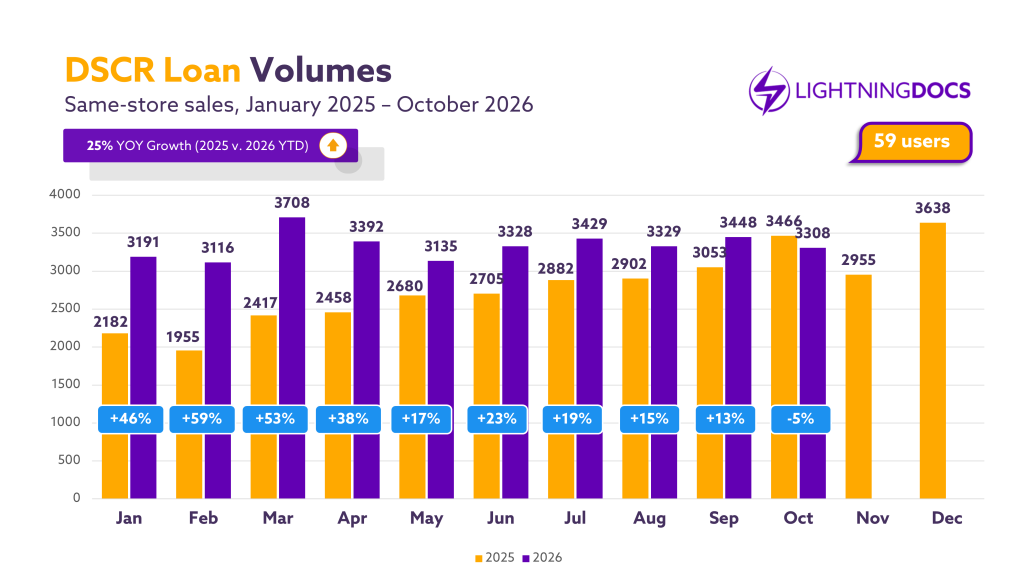
In October, DSCR posted its first year-over-year decline, down 5% for the month. Rising Treasury yields and increased competition weighed on the product all year, yet it still grew 25% through October. October’s 44-basis-point rate increase appears to be what finally caught up with it. Two points add additional context. First, October 2025 was the third-highest month on record for DSCR, making for a tough comparison. Second, with 3,308 loans among the 59 DSCR lenders using Lightning Docs since the start of 2025, October 2026 was still a strong month in absolute terms.
What Happened to DSCR Rates and Loan Amounts in September?
This chart puts the scale of October’s DSCR rate increase in perspective. In the previous 12 months, DSCR rates stayed within a 32-basis-point band (6.94%–7.26%); then, in a single month, they surged 44 basis points to 7.70%. Average loan amounts moved the other way, falling to $298,000, tied with May for the lowest average of the year. Many DSCR underwrites and ratios simply fail at these rates.

How Did Bridge and DSCR Rates Respond to Benchmark Rates in October?
October was one of the most volatile months on record for our benchmark rates and DSCR. After rising 31 basis points in September, 10-year Treasury yields climbed another 14 bps in October. Consumer mortgages followed with a 47-bp increase in October, as did DSCR with a 44-bp increase. Bridge loans, meanwhile, were largely unaffected, rising just 4 bps.
More telling is how DSCR spreads have shifted. After reaching a record low of 2.27%, the spread between DSCR and Treasuries widened to 2.57% in October, a sign that secondary-market investors are beginning to demand higher returns. Even so, the spread between DSCR and consumer mortgages narrowed again, to just 37 bps from 99 bps a year ago.
Which States and Counties Led DSCR Lending Through October?
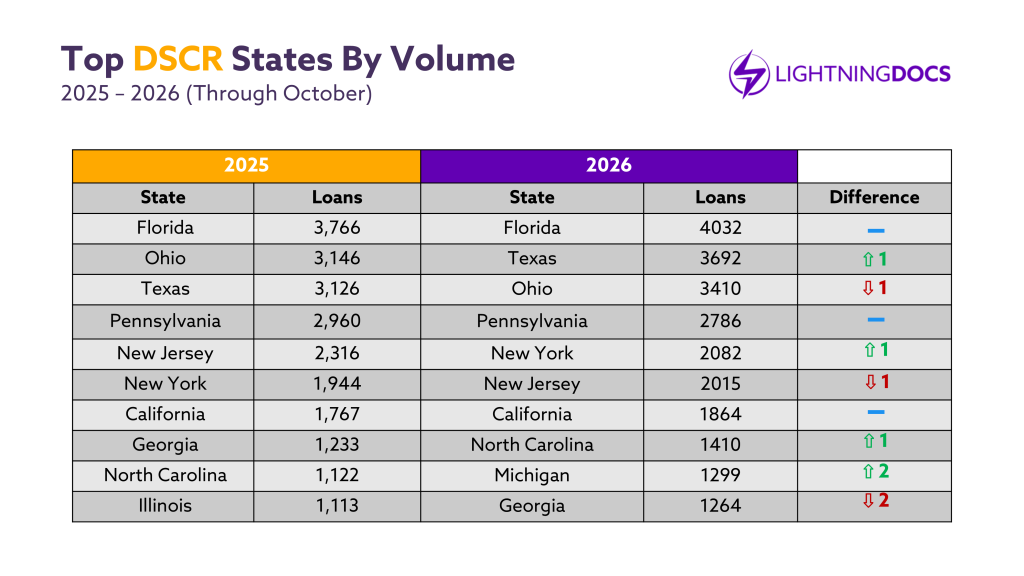
Annual rankings held steady at the top, with the top 10 states for the year in the same order. In October, Florida grew 12% from September, while Texas fell 13% and Pennsylvania fell 19%. Indiana, Massachusetts, and Washington each had their strongest month of the year. Indiana, 15th for the year, finished 11th for the month with 122 loans, while Massachusetts (23rd for the year) and Washington (25th) finished 17th and 19th for the month. Missouri, 11th for the year, rebounded 43% from September to 136 loans and finished 10th for the month. Maryland, 14th for the year, continued to cool after a hot start to 2026, falling to 50 loans for the month from 135 in January.
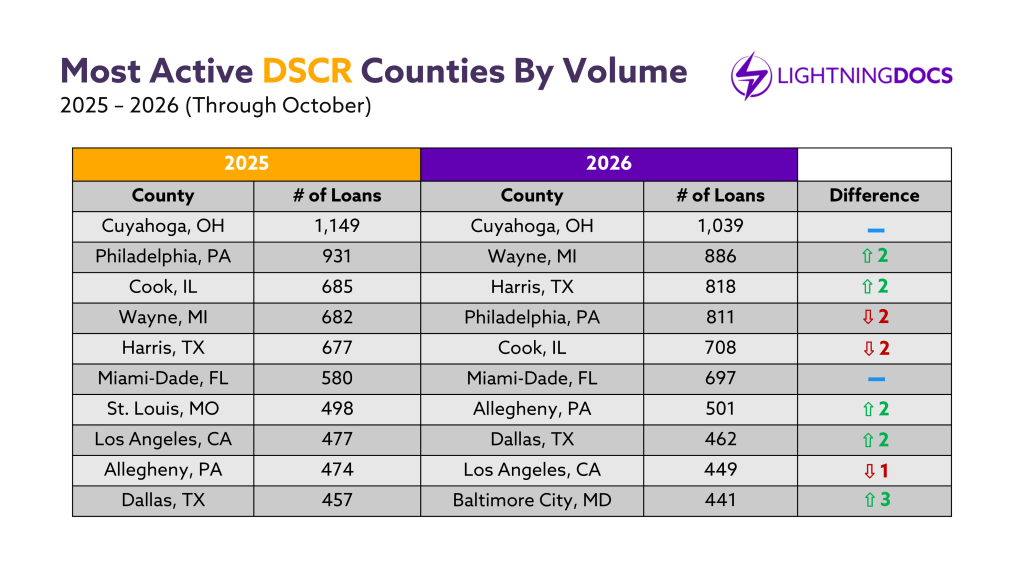
With just 53 loans, Harris, TX (3rd for the year, Houston metropolitan area) had its slowest month of the year. Like Maryland at the state level, Baltimore City, MD, has slowed significantly through the year and had its weakest month with just 21 loans. It now holds its place in the annual top 10 by just 14 loans after Los Angeles moved ahead of it into 9th. Outside the top 10, Milwaukee, WI, had its strongest month of the year, while Jackson, MO, and Shelby, TN, each posted top-10 volume for the month, extending their climb up the annual list.
October’s Private Lending Takeaways: What Does the Data Mean for Lenders and Investors?
October put pressure on both products, but unevenly. Bridge lending grew 7% year-over-year with rates up just 4 basis points. DSCR fared worse: rates rose 44 basis points to 7.70%, and transaction volume fell 5% year-over-year, its first decline of 2026. Meanwhile, Elementix data adds context to the broader market: the top 100 lenders are up 3.6% year-over-year, and growth is concentrated among multi-regional and national lenders while local lenders decline sharply.
About the Author
Nema Daghbandan, Esq. is the CEO and co-founder of Lightning Docs. He currently leads the Lightning Docs team, managing strategic initiatives and relationships. Mr. Daghbandan also serves as a Partner at Fortra Law, the nation’s largest private lending law firm. Mr. Daghbandan has unique expertise in understanding the needs of private mortgage lenders.
As an attorney, Mr. Daghbandan has been recognized by his peers in the legal community by Super Lawyers® in 2026. Only 2.5% of attorneys receive this distinction.
Definitions
A bridge loan is any loan with a duration of 36 months or less utilizing interest-only payments for the duration of the term and containing a balloon payment at the end of the loan. Bridge loans are commonly referred to as residential transition loans (RTL), fix-and-flip, non-owner occupied, hard money, or in other terms that describe a short-term loan generally secured by a residential property for investment purposes.
DSCR loans are 30-year term loans secured by rental properties. DSCR stands for Debt Service Coverage Ratio, which identifies that the primary underwriting for these loans is done by dividing the monthly net operating income of the property by the monthly debt service.
A User refers to a unique company using the Lightning Docs platform. If multiple individuals within the same company access the platform, they are collectively counted as a single user.
Methodology
Loans below $50,000 and above $5,000,000 have been removed from the data set.
Loans with interest rates below 4% and above 20% have been removed from the data set.
For the loan volume slides, the user must have signed up with Lightning Docs prior to 2025.
Related Content