How the September Fed Rate Hike Impacted DSCR and Bridge Loan Markets
Nema Daghbandan, CEO
September brought the first Fed rate increase since 2023 and, with it, renewed concerns about rising rates within business-purpose lending. As I covered here, the increase was heavily anticipated within our industry and had been a factor in the rate movement of the last couple of months. DSCR rates have risen recently, but by much less than 10-year Treasury yields and consumer mortgage rates for now.
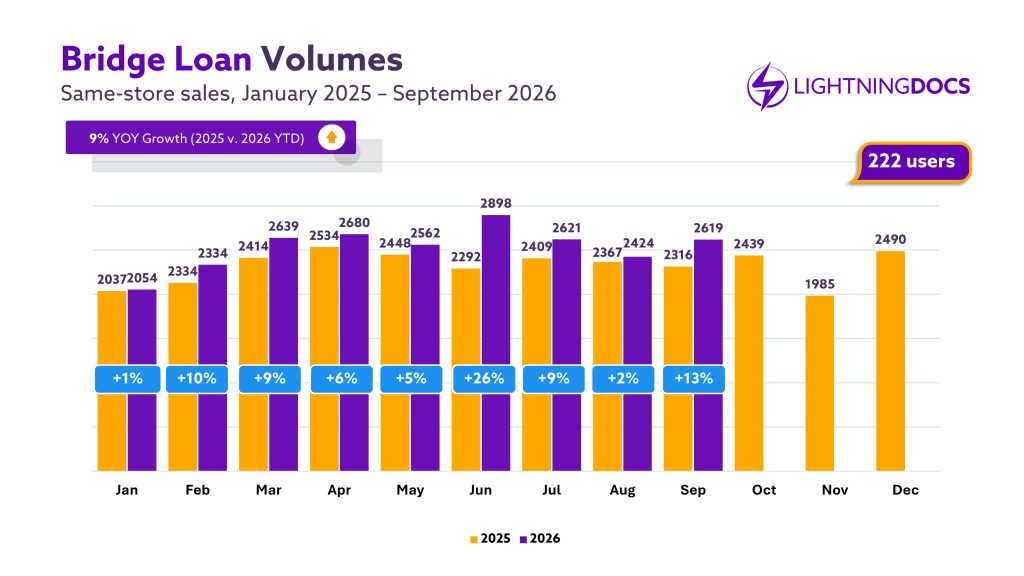
Private lending volume held up in September despite the Fed’s rate increase. Bridge lending rebounded to 13% year-over-year growth, led by ground-up construction (up 36%) and fix-and-flip (up 21%), while non-construction bridge volume fell to its lowest month of the year. DSCR set a new quarterly volume record, even as a rising rate environment pushed record low spreads even tighter.
Want the Full Picture?
The trends in this article are just a snapshot. The complete Lightning Docs Private Lending Market Report includes deeper, market-by-market detail for private lending professionals:
- Expanded Regional Breakdowns: State and metro-level data beyond the national averages shown in this article
- Above-Average Rate Markets: See exactly which regions are commanding higher interest rates, and why
- Above-Average Loan Amount Markets: Identify where deal sizes are outpacing the national norm
- Volume Heat Maps: Visualize lending activity concentration across the country at a glance
How Much Did Bridge Loan Volume Grow in September?
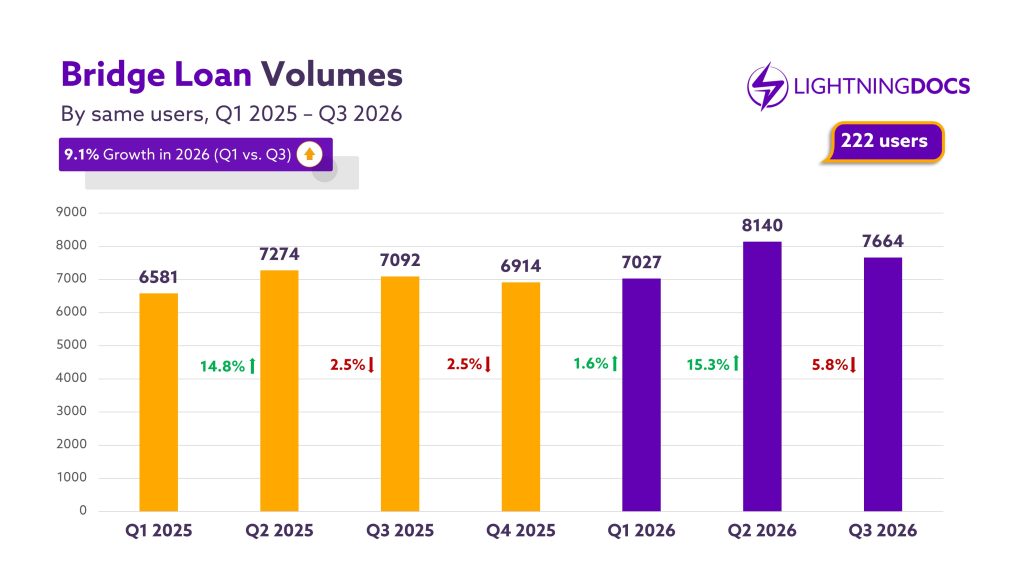
Among same-store users, bridge loan transactions rebounded from nearly flat year-over-year growth in August to post 13% growth in September, the second strongest month of 2026 so far. Year-to-date growth remains consistent at 9%, though Q3 transaction volume is down 5.8% from Q2, a pattern that carried over from 2025.
Bridge Loans Broken Down: How Bridge Categories Performed in September
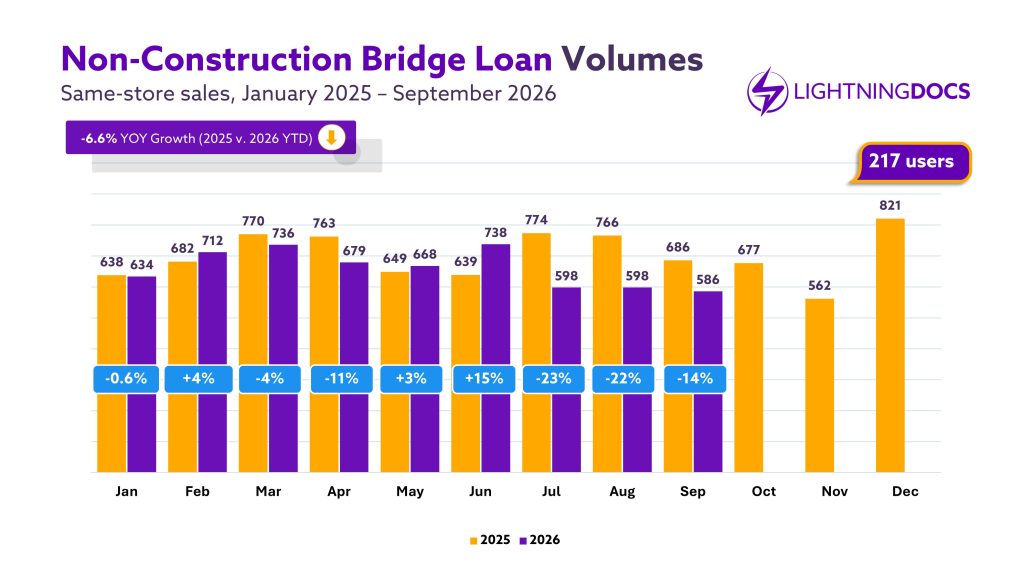
As I highlighted for the first time last month, the individual products within the bridge loan market tell a different story. Non-construction bridge loan transactions continued to decline in September, down both year-over-year and from the previous month. At just 586 transactions, September was the lowest month of the year for the segment.
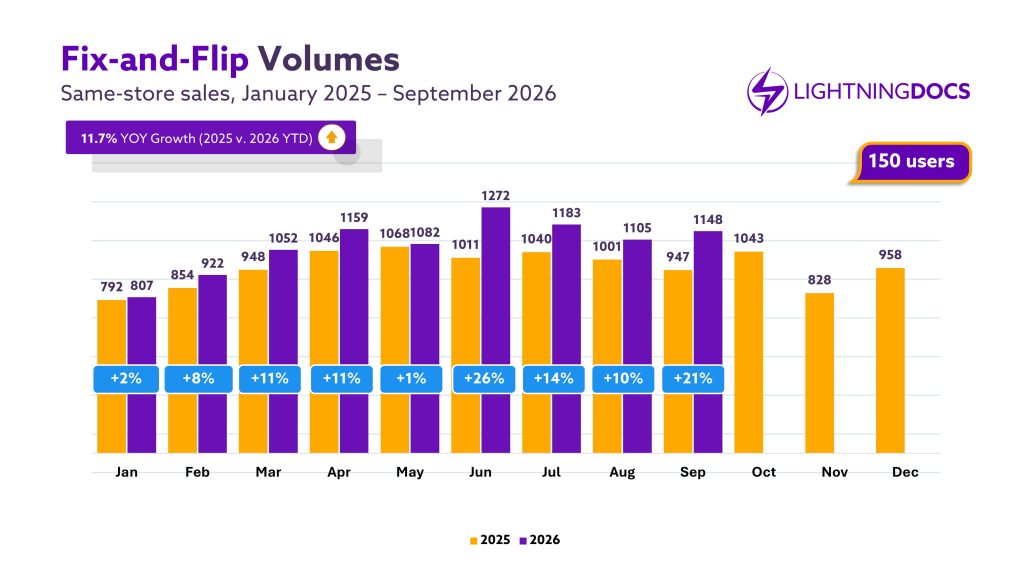
Fix-and-flip loans were up 21% year-over-year in September, accelerating from 10% growth in August. For the year, the fix-and-flip segment is slightly outperforming the overall bridge loan market.
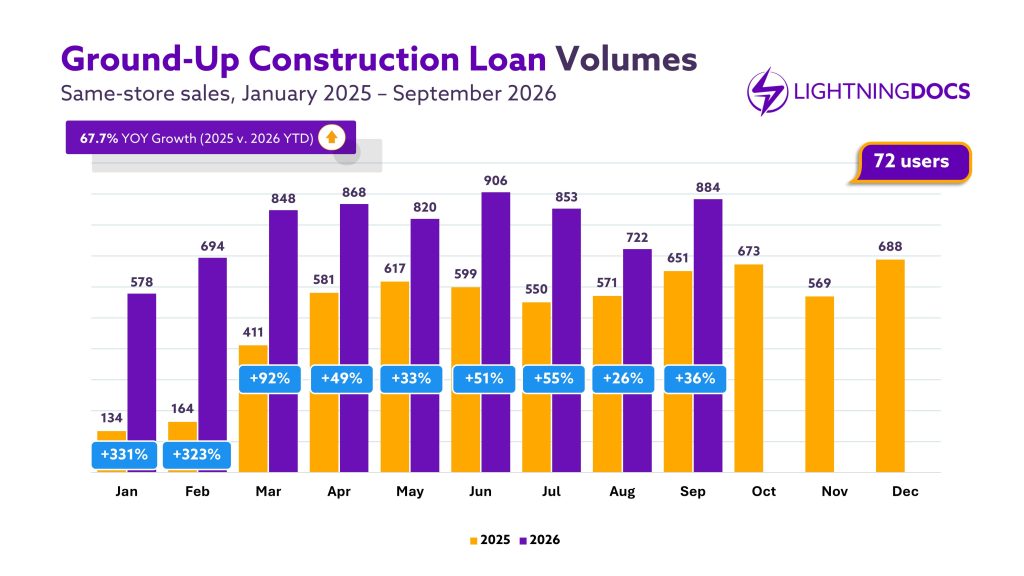
Ground-up construction continues to be the main driver of growth for bridge loans. With 884 transactions in September, ground-up was up 36% year-over-year and posted the second highest month of 2026. Just 72 Lightning Docs users produced ground-up construction loans, and those lenders closed an average of 12.2 each in September, compared to 7.4 for fix-and-flip users and 2.7 for non-construction bridge users.
What Happened to Bridge Loan Interest Rates in September?
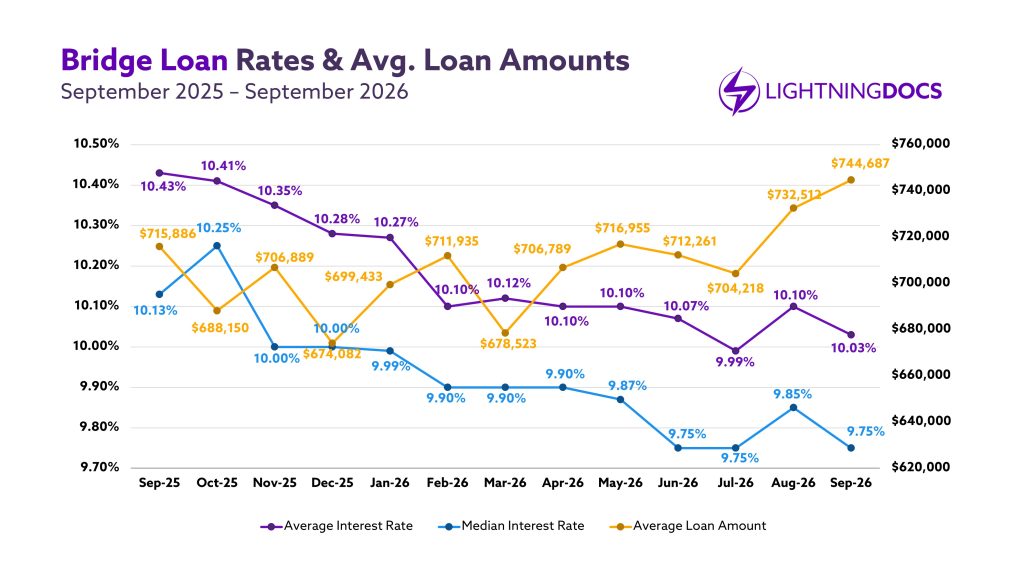
Despite rates rising nearly everywhere else, bridge loan rates surprisingly dropped 7 basis points to 10.03% in September. Average loan amounts rose again to $744,687 nationally, the highest monthly average on record for Lightning Docs.
How Did Bridge Loan Pricing Shift in September?
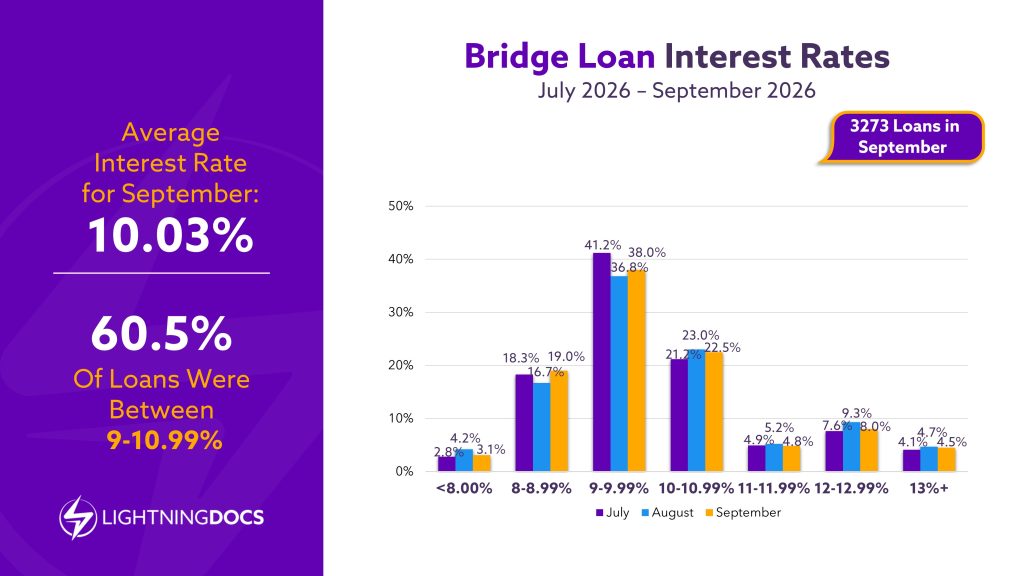
With September’s average interest rate having boomeranged back closer to July’s yearly rate low (10.03% compared to 9.99%, respectively), we’re seeing rates similarly shift back to the middle-market distribution we observed earlier this quarter. Compared to last month, where the combined 9-10.99% segment fell under 60% for the first time this year, September saw that middle sector rebound to 60.5%.
The largest rate bucket remained 9.00%-9.99%, accounting for 38.0% of all loans in September, up from 36.8% in August, while the share of loans in the 8.00%-8.99% range increased to 19.0% from 16.7%. At the same time, the 10.00%-10.99% category eased slightly from 23.0% to 22.5%. The most notable change occurred at the higher end of the market, where loans priced between 12.00%-12.99% fell from 9.3% to 8.0%, reversing August’s increase.
Which States and Counties are Leading Bridge Lending?
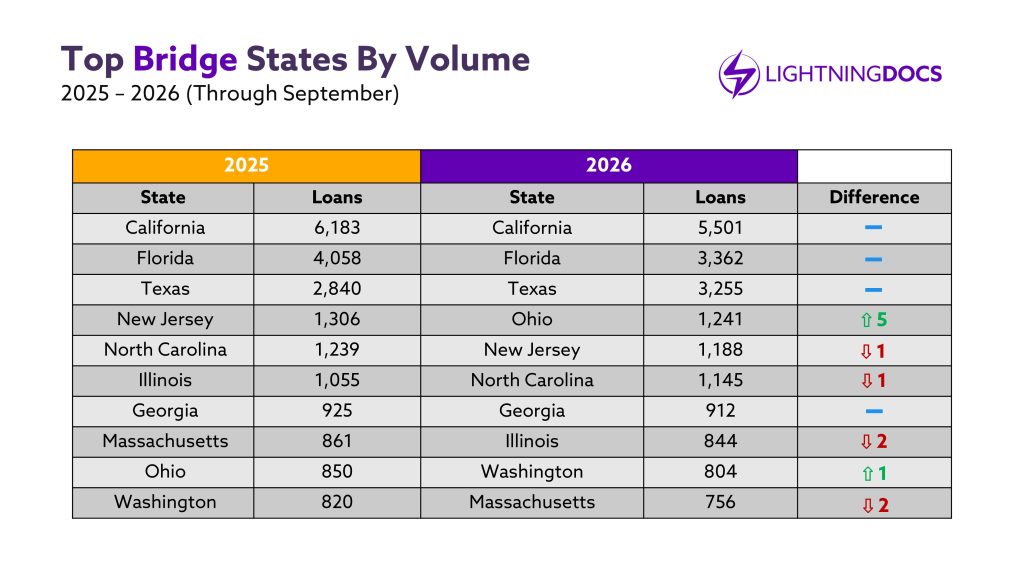
As we transition to the final quarter of the year, we’re seeing relatively little movement in the top markets. This is particularly true from a state perspective, where the top 10 have solidified into their places from August to September. California, Florida, and Texas continue to dominate the bridge lending market, with Ohio making the biggest strides amongst the top ten markets.
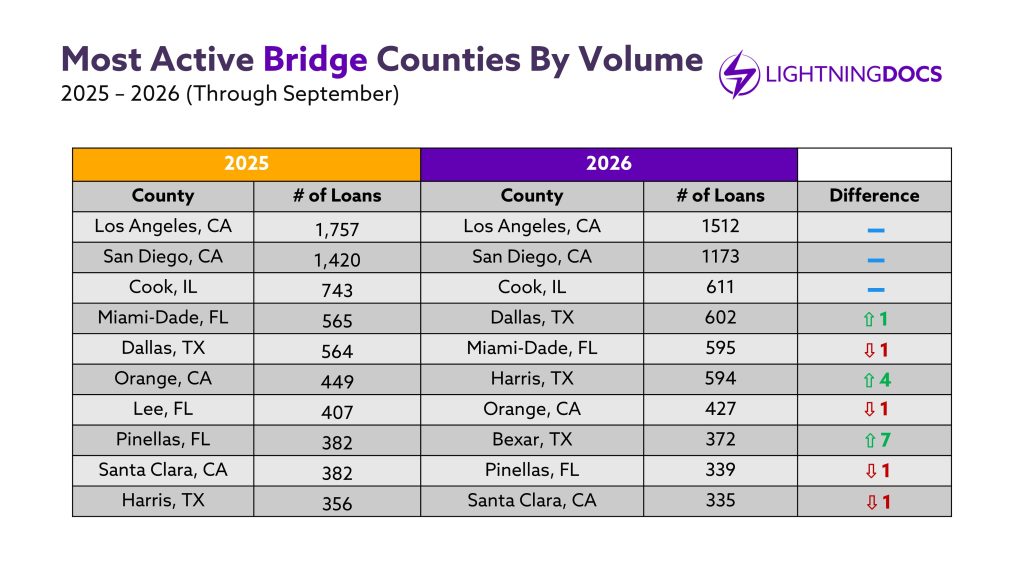
I noted in Lightning Docs’ recent Key Markets report that Texas broke out as a fast-growing bridge market, and last month Dallas, TX reaffirmed that sentiment. The county moved ahead of Miami-Dade to become the fourth most active bridge lending market, having closed 92 loans in September even surpassing Cook, IL’s 72, which sits in the number three spot.
How Did DSCR Lending Volume Grow in September?
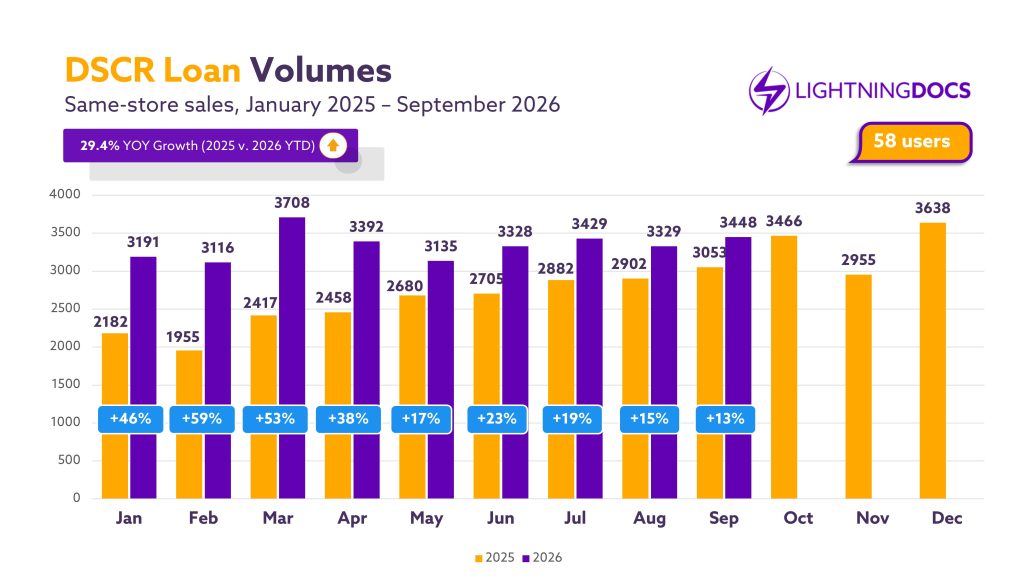
Despite sour market sentiment, DSCR transactions remained resilient in September. Among Lightning Docs users with us since the start of 2025, the 3,448 DSCR loans closed in September made it the second strongest month of the year and equaled 13% year-over-year growth. As noted last month, the strong finish to 2025 has made it harder to match the growth rates seen at the start of this year. Year-to-date, DSCR is still up nearly 30% despite the broader economic headwinds.
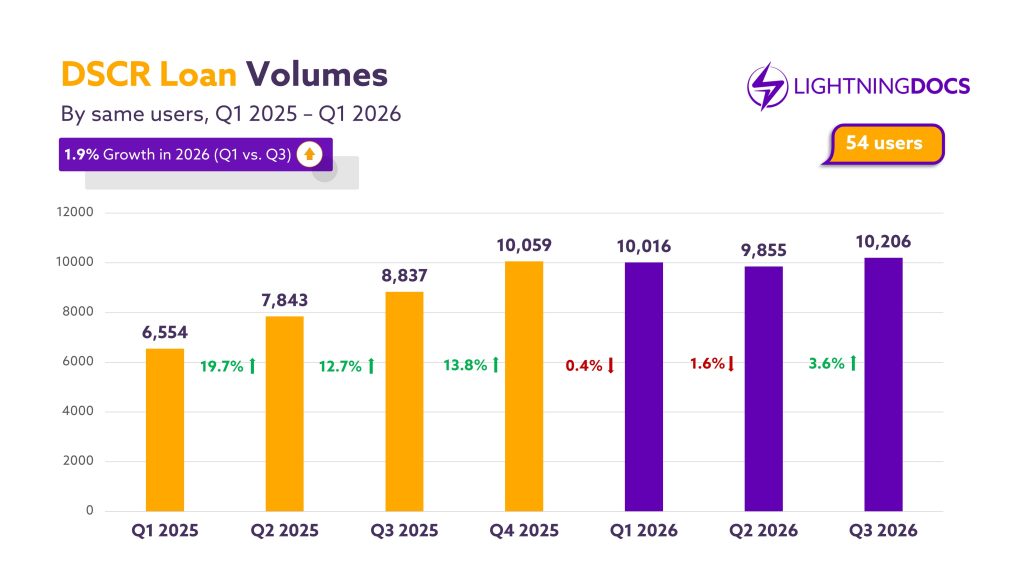
Looking at quarter-over-quarter growth, DSCR has slowed. Q1 and Q2 of 2026 both fell short of the previous all-time high set in Q4 of 2025. Q3 set a new quarterly all-time high, though it was up just 3.6% from Q2.
What Happened to DSCR Rates and Loan Amounts in September?
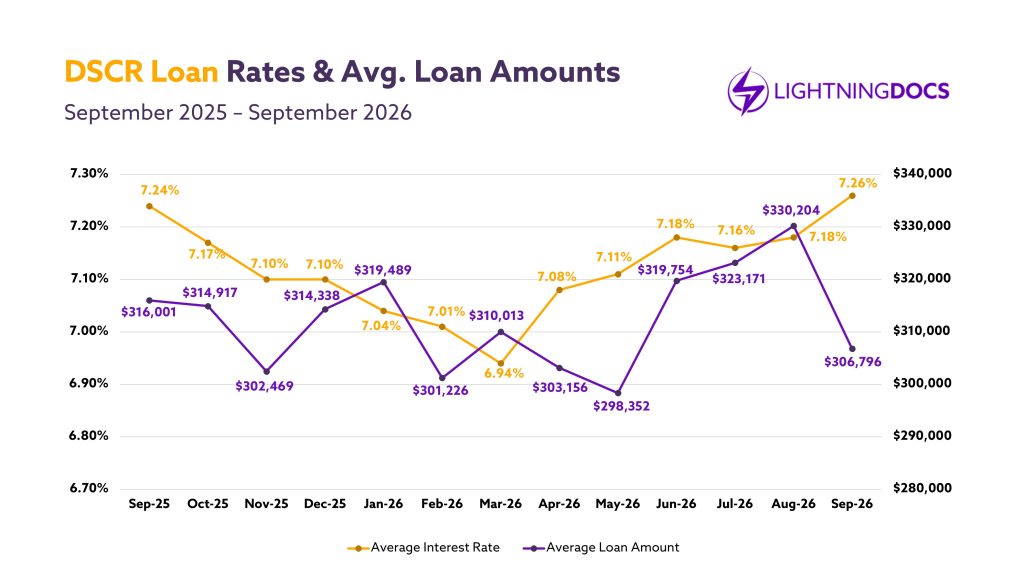
DSCR rates and loan amounts moved in the opposite direction of bridge loans in September. Average DSCR interest rates climbed 8 basis points to a new 12-month high, though that is a much smaller increase than the benchmark rate moves covered below. It is unlikely DSCR rates can continue to defy treasury pressures as they have been able to for the last few months. Average loan amounts had a fairly significant drop from August’s high of $330,204 to $306,796.
How did the DSCR Rate Distribution Shift in September?
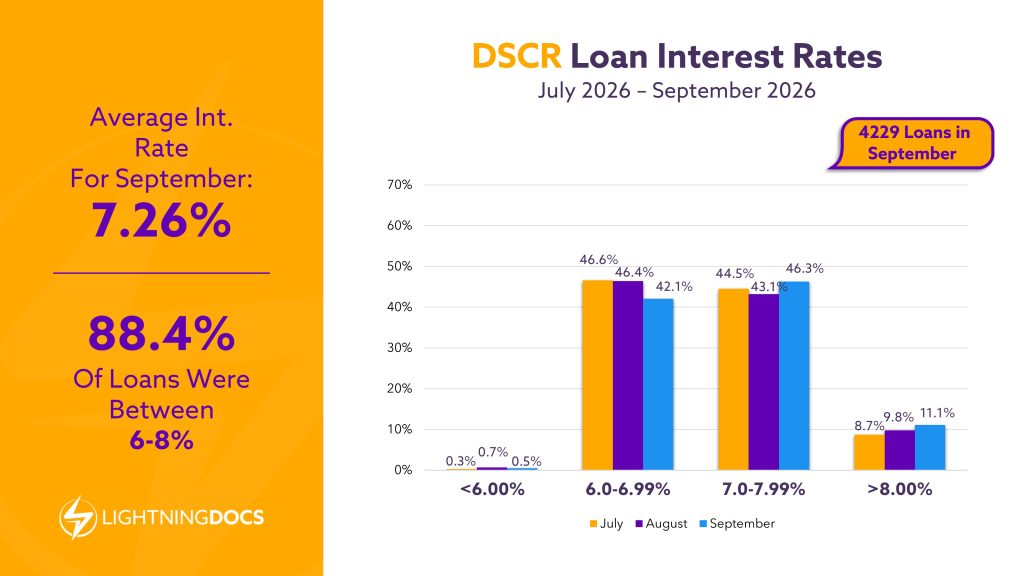
Though September’s average DSCR interest rate grew moderately compared to the increases recorded in benchmark rates, September’s DSCR rate distribution shifted noticeably toward higher borrowing costs compared to both July and August.
The share of loans closing in the 6.0%-6.99% range fell to 42.1%, down from 46.4% in August, marking the lowest concentration in this lower-rate bucket during the three-month period. At the same time, loans in the 7.0%-7.99% range climbed to 46.3%, becoming the largest rate category. Significant movement occurred above 8%, where the share of loans increased to 11.1%. Overall, the September data reflects a broad migration toward higher rate tiers, reflecting the increase in the overall average interest rate.
How Did Bridge and DSCR Rates Respond to Benchmark Rates in September?
Private lending rates moved only modestly against the Fed’s increase, with bridge rates down 7 basis points and DSCR rates up 8. Consumer mortgage rates rose 19 basis points in September to 6.86%, narrowing the spread between consumer mortgages and DSCR to just 40 basis points, an all-time record low. Incredibly, the 10-year Treasury rose 31 basis points, and with DSCR’s smaller increase, the spread between the two is now 2.27%. With spreads at record lows, demand for DSCR remains incredibly high, although margin pressure is likely felt among mortgage lenders when selling these loans.

Which States and Counties are Leading DSCR Lending?
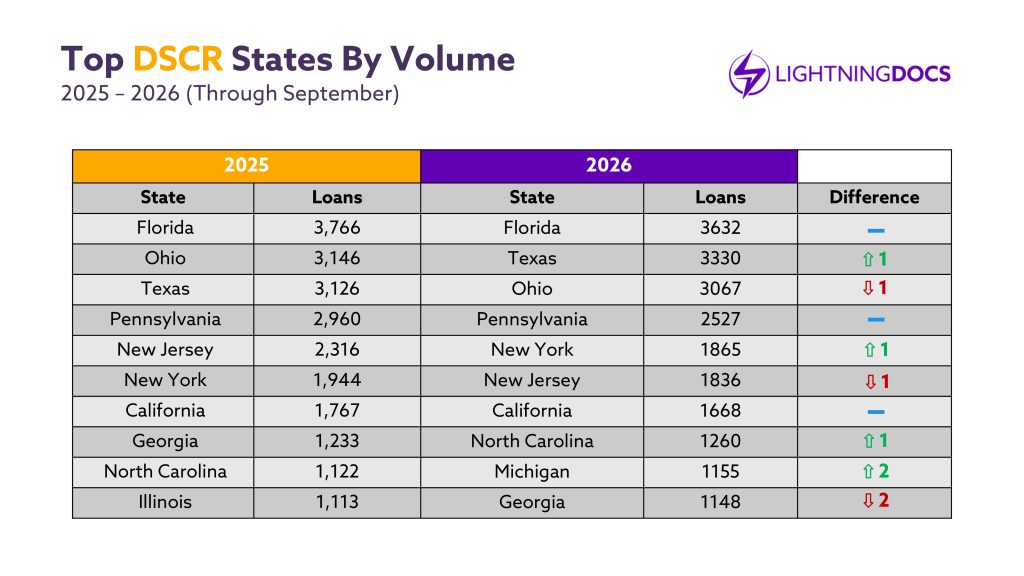
Like bridge lending, the most productive markets in DSCR for the year have generally settled into a comfortable lending cadence, with limited movement in the top markets. Florida, Texas, and Ohio continue to drive much of DSCR lending volume, though compared to last year Texas is edging out Ohio in transaction volume. Texas is also the only state among the top ten to have surpassed its cumulative annual DSCR loan volume in 2025 with three months left to go in the year.
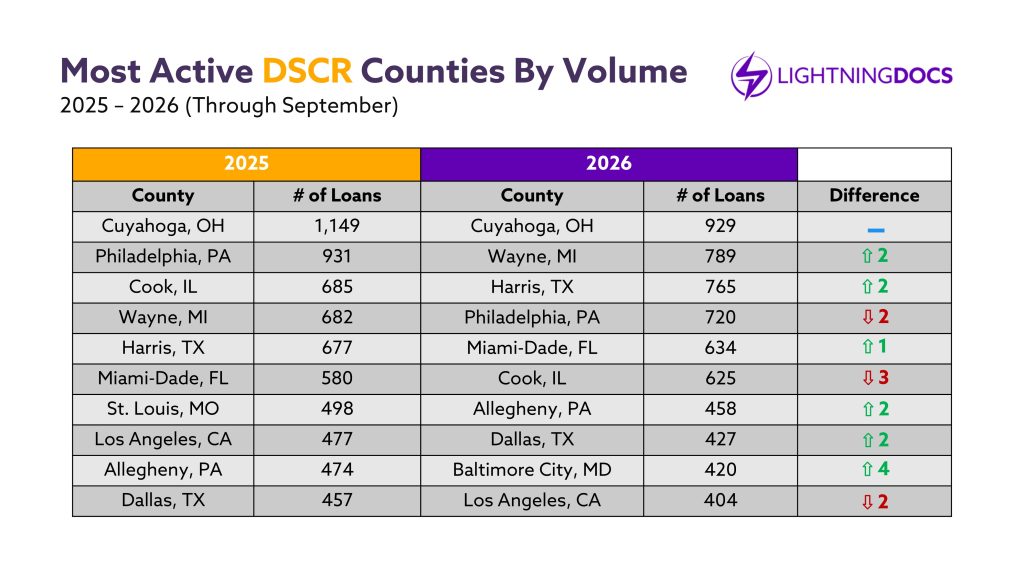
On the county level, Los Angeles, CA, which ended August at eleventh place, replaced Jackson, MO’s number ten spot, having closed 58 loans in September.
September’s Private Lending Takeaways: What Does the Data Mean for Lenders and Investors?
September’s data highlights a private lending market that remains remarkably resilient despite a higher-rate environment. Bridge lending continued to gain momentum, supported by strong growth in ground-up construction activity and rising loan balances, while average bridge rates actually declined and became more concentrated below 10%. On the DSCR side, origination volume remained near record levels, although rate distributions shifted modestly higher as more loans priced above 8%.
For lenders, the data suggests that borrower demand remains healthy even as financing costs rise, creating opportunities to grow volume in both construction and investor lending segments. Overall, September’s results reinforce the same theme seen throughout much of 2026: private lending continues to expand, with investors and lenders adapting successfully to a changing interest rate environment rather than retreating from it.
Definitions
A bridge loan is any loan with a duration of 36 months or less utilizing interest-only payments for the duration of the term and containing a balloon payment at the end of the loan. Bridge loans are commonly referred to as residential transition loans (RTL), fix-and-flip, non-owner occupied, hard money, or in other terms that describe a short-term loan generally secured by a residential property for investment purposes.
DSCR loans are 30-year term loans secured by rental properties. DSCR stands for Debt Service Coverage Ratio, which identifies that the primary underwriting for these loans is done by dividing the monthly net operating income of the property by the monthly debt service.
A User refers to a unique company using the Lightning Docs platform. If multiple individuals within the same company access the platform, they are collectively counted as a single user.
Methodology
Loans below $50,000 and above $5,000,000 have been removed from the data set.
Loans with interest rates below 4% and above 20% have been removed from the data set.
For the loan volume slides, the user must have signed up with Lightning Docs prior to 2025.