Definitions
A bridge loan is any loan with a duration of 36 months or less utilizing interest-only payments for the duration of the term and containing a balloon payment at the end of the loan. Bridge loans are commonly referred to as residential transition loans (RTL), fix-and-flip, non-owner occupied, hard money, or in other terms that describe a short-term loan generally secured by a residential property for investment purposes.
DSCR loans are 30-year term loans secured by rental properties. DSCR stands for Debt Service Coverage Ratio, which identifies that the primary underwriting for these loans is done by dividing the monthly net operating income of the property by the monthly debt service.
A User refers to a unique company using the Lightning Docs platform. If multiple individuals within the same company access the platform, they are collectively counted as a single user.
Methodology
Loans below $50,000 and above $5,000,000 have been removed from the data set.
Loans with interest rates below 4% and above 20% have been removed from the data set.
For the loan volume slides, the user must have signed up with Lightning Docs prior to 2025.
With 22 business days, expectations for March were high — and the 351 users active on Lightning Docs in March made sure those expectations were met. For the first time ever, Lightning Docs surpassed 7,000 loans in a single month.
It was just last April that we crossed the 5,000 loan threshold, and at that time we were blown away: not just by the adoption of Lightning Docs, but by the growth of private lending as a whole. Less than a year later, reaching 7,000 is a monumental achievement and a clear signal of the industry’s resilience.
Let’s dive into what contributed to this growth and where opportunities are presenting themselves at the end of this first quarter of 2026.
Bridge Loan Volumes: Tepid Growth
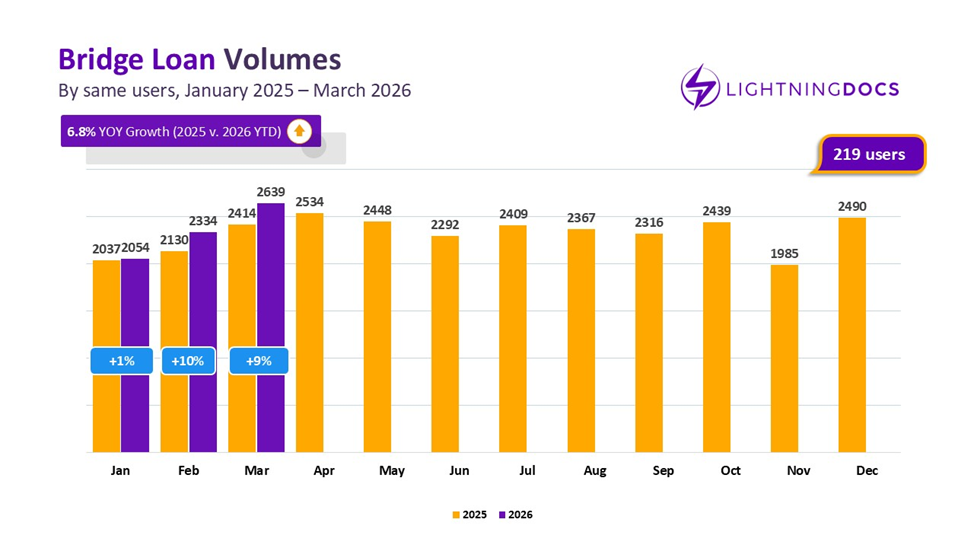
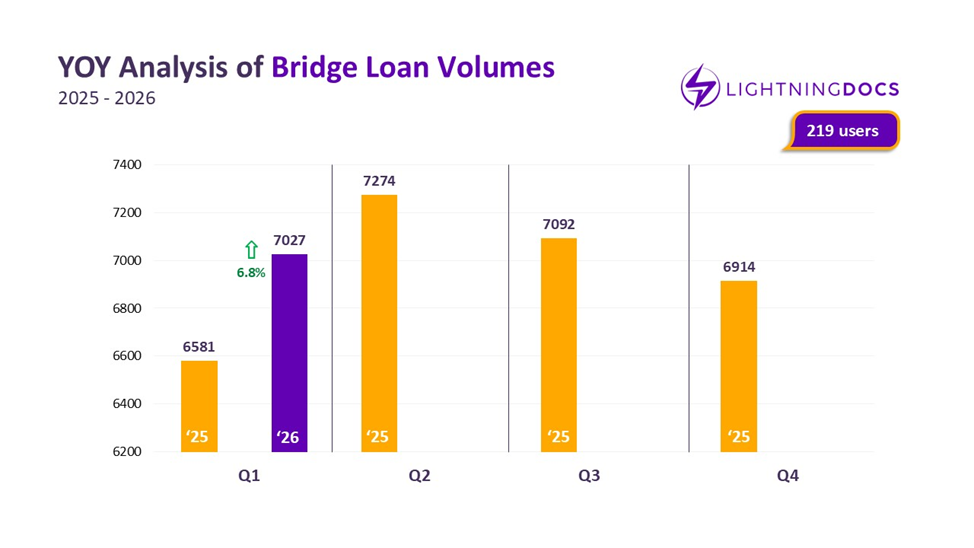
Bridge loans showed continued growth in March, building on February’s renewed momentum. Users who have been active on Lightning Docs since the start of 2025 produced 2,637 bridge loans last month—a 9% increase compared to March of last year, bringing year-over-year growth to 6.8% when comparing Q1 2026 to Q1 2025 across the same 219 users.
Bridge lending continues to face significant headwinds with widely reported compressed margins for real estate investors flipping properties, longer days on market creating more significant carrying costs, and rising costs of labor and materials — all of which result in a challenging environment for bridge loan borrowers.
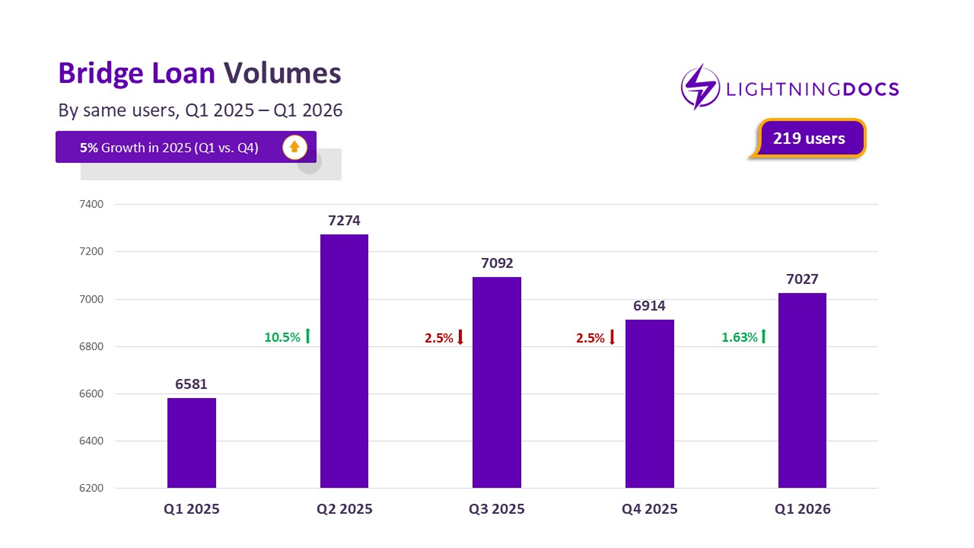
In more positive news, Q1 2026’s represented a slight increase from Q4 2025 volumes (1.63%) and a more significant 6.8% in year-over-year growth from Q1 2025 that we can be cautiously optimistic about. However, to put this growth into perspective, Q1 volumes increased by 51 percent when comparing Q1 2024 to Q1 2025 across the same 170 users. Hopefully, quarterly numbers continue to increase in the months ahead.
Q1 Trends in Bridge Loan Interest Rates & Amounts
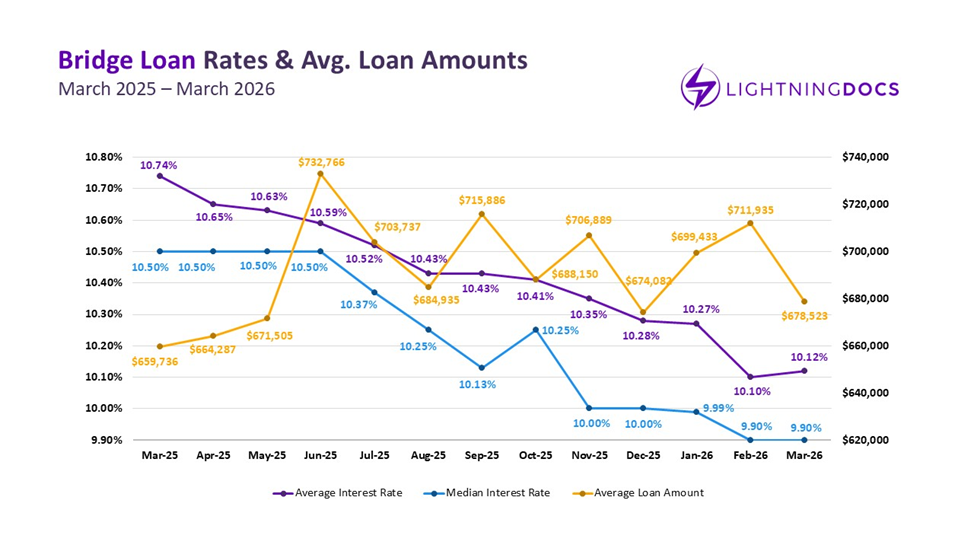
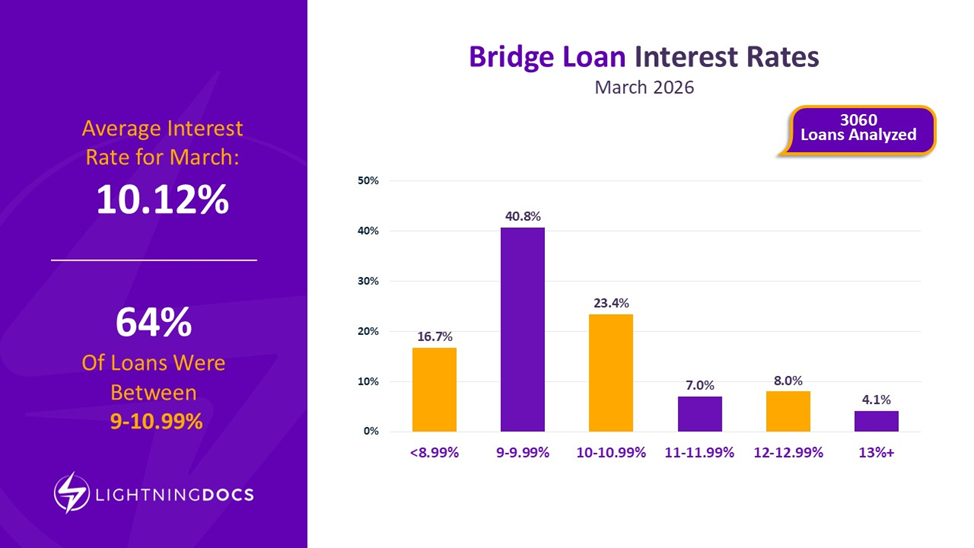
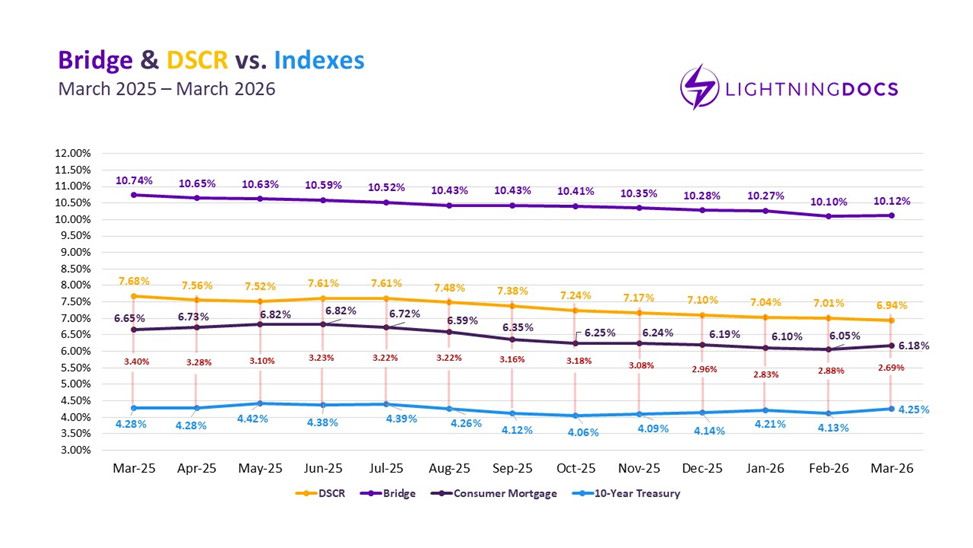
Following February’s interest nosedive, which saw rates falling 17 basis points to 10.10% compared to January, March saw a slight rebound, with an average of 10.12%.
Despite this two-basis-point increase, overall rates remain lower, and distribution trends show a growing concentration of loans in the 9–9.99% range. This shift may indicate a near-term plateau, contrasting with earlier projections of sub-10% averages based on steady declines observed since early 2025.
The average in bridge loan amounts has dropped under $680,000 for the first time this year, protracting the period of up-and-down oscillation we’ve seen since May 2025. Though we may continue to see some volatility, it’s worth noting that last month’s decline in loan amounts is the largest monthly decrease we’ve seen in the past year, slightly exceeding the November-December 2025 dip.
Anecdotally, many Lightning Docs users complain of higher risk environments in which leverage is pushing to unsustainable levels — however, the decreasing average loan balances tend to demonstrate a potential de-risking occurring across lender portfolios.
Top U.S. States for Bridge Loan Activity
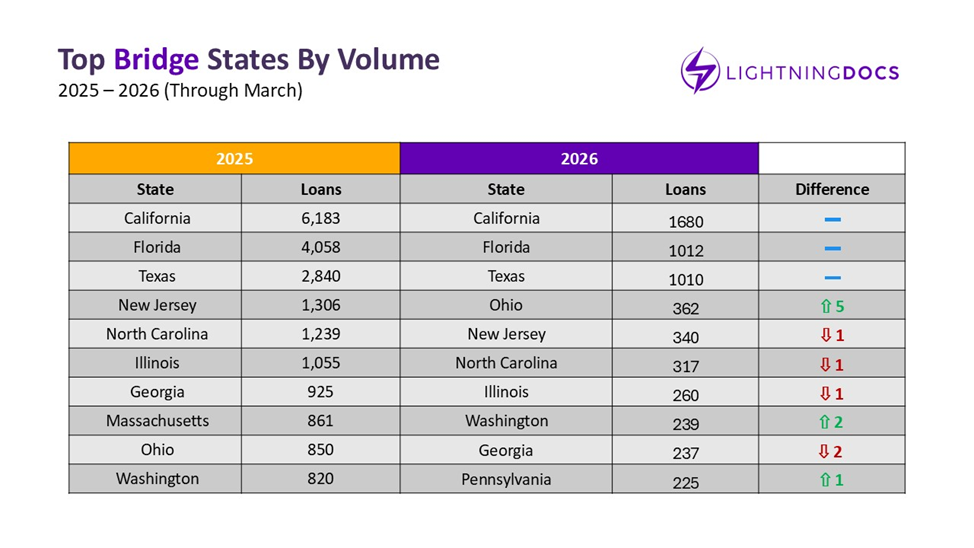
As loan volumes accumulate, many of the states that ranked in the Top 10 at the end of last year continue to hold their positions, with some reshuffling along the way. Ohio, in particular, is building on recent momentum and climbing the ranks.
Compared to last month, New York has fallen out of the Top 10, with Pennsylvania taking its place. Expanding the view to the Top 20, Massachusetts, Oregon, and Arizona are gaining traction and are worth watching as we move into Q2.
Most Active Counties in Bridge Lending
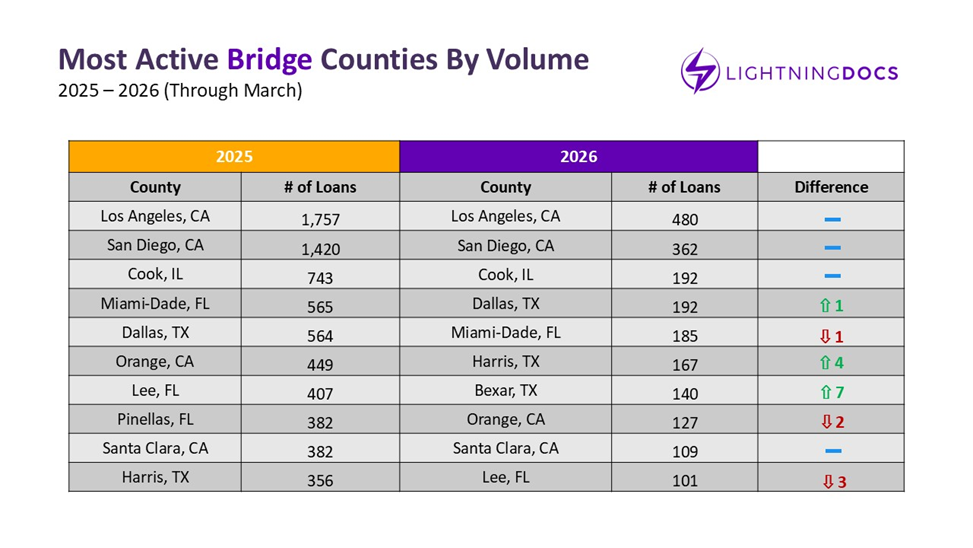
Looking at the counties that are leading the bridge loan charge, we can see that Bexar County’s (San Antonio metro) stratospheric rise wasn’t just a January story. With 70 loans in March alone, comprising 50% of their total bridge loan volume this year, the county had the third highest volume of any bridge county making gains in rank — and gain in rank it did, jumping up seven places compared to the end of 2025 and two places in just a month. Meanwhile, Cook, IL (Chicago metro) rebounded from a quieter February to reclaim its #3 position.
DSCR Loan Volume Growth: A Breakout Q1 for 2026
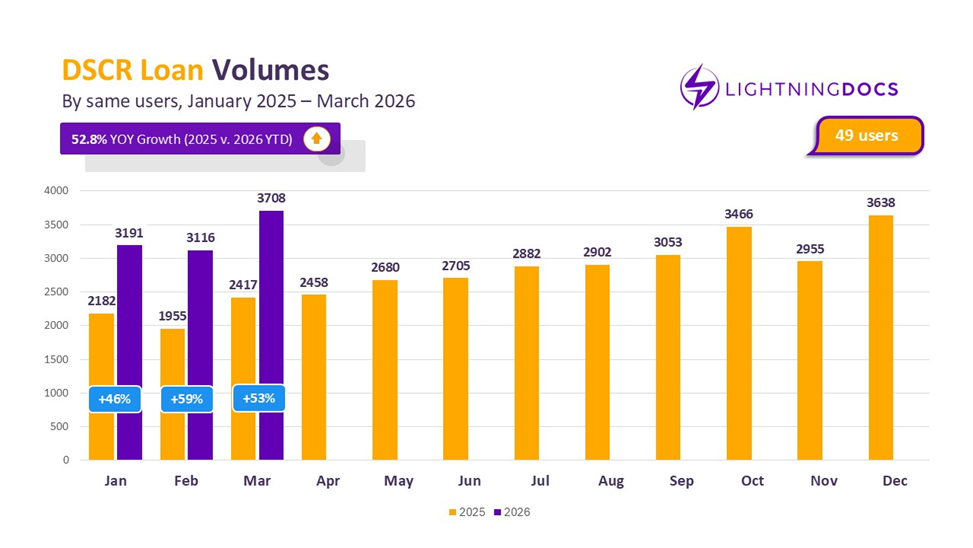
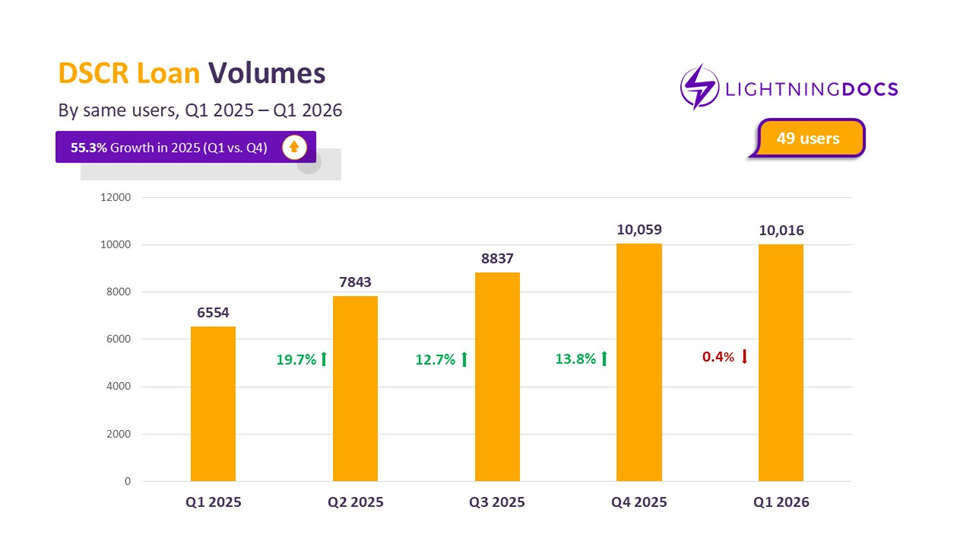
DSCR loans have maintained a strong upward trajectory since last year, where they grew 55.3% from Q1 to Q4 2025 across the same users. This year, March further reinforces this trend with volume surging to 3,708, surpassing last year’s peak by 70 loans and increasing by 19% compared to this February, although with three extra business days accounting for much of the difference.
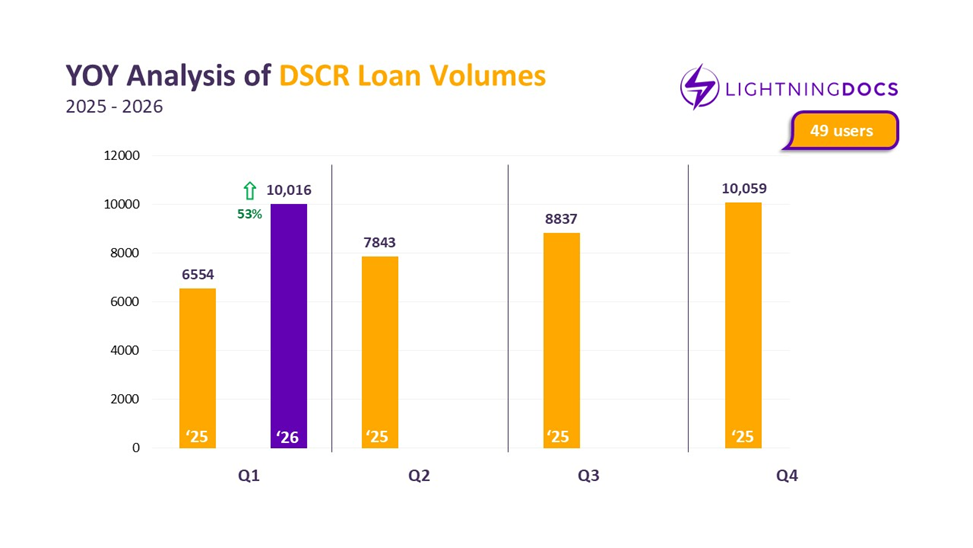
With a total of 10,016 DSCR loans, Q1 2026 was close to hitting the quarterly DSCR loan record we achieved in Q4 of 2025. Regardless, Q1 2026 increased 54% from Q1 2025, demonstrating significant resiliency — particularly in comparison to an anemic bridge growth of less than 10%. It is highly unlikely that the entire DSCR sector is growing at this rapid of a rate, but the 49 tech-enabled DSCR lenders using our software are clearly able to outperform.
DSCR Loan Interest Rates Drop as Amounts Rebound, Signaling Demand
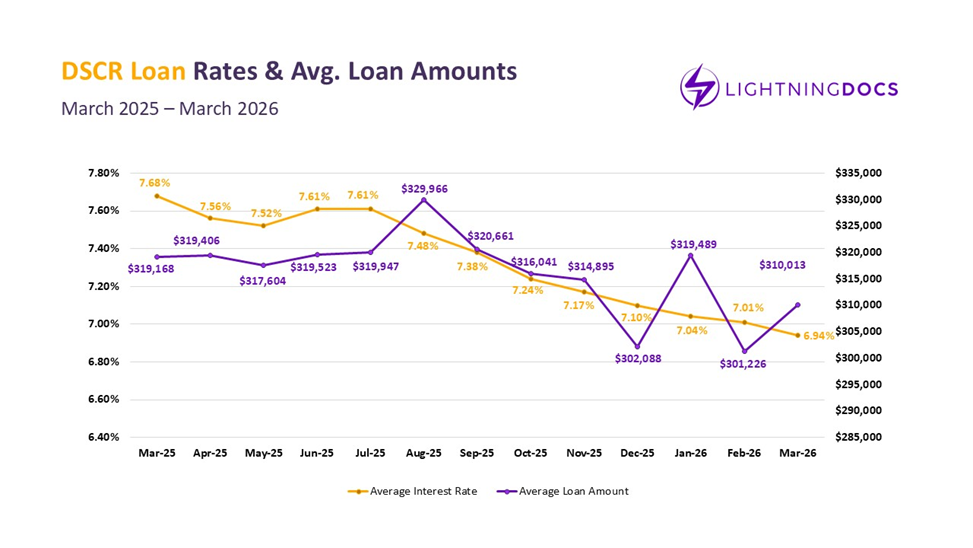
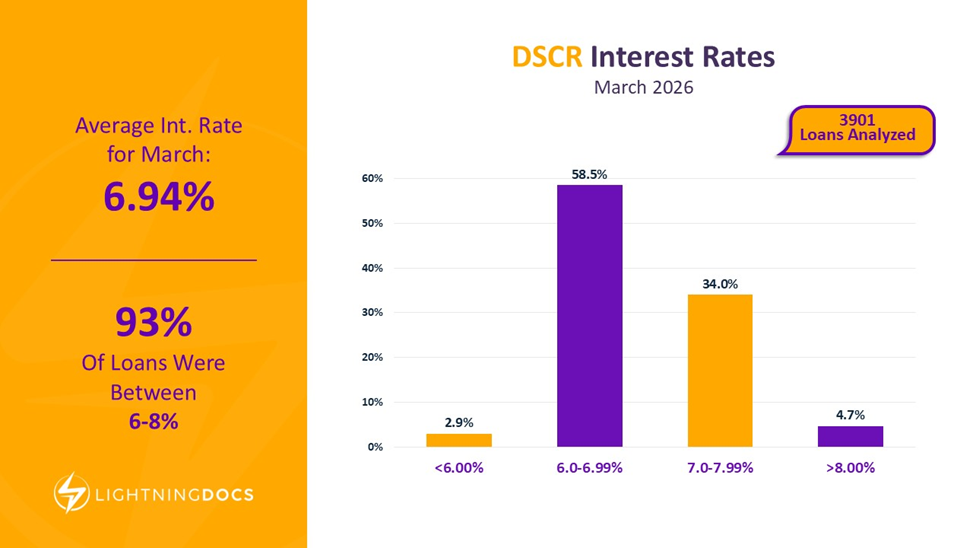
Interest rates for DSCR loans are averaging below 7% for the first time since June 2022, likely factoring into the higher volumes we’ve seen as borrowers and investors alike look to take advantage.
This is reflected in the rate distribution as well, with almost 60% of all DSCR loans falling between 6.0-6.99%. Meanwhile, the 7%+ segments have collectively declined, suggesting a shift toward more favorable financing conditions.
National average loan amounts continue to stay stable between $300-$310k. Due to the war with Iran and consequent oil price increases, March brought tremendous uncertainty as we saw the treasury markets fluctuating wildly. The ultimate question will be whether this level of uncertainty will result in an actual change in origination activity.
Understanding Interest Rate Spreads in the 2026 Lending Market
While interest rates have remained comparatively down for both bridge and DSCR loans — particularly for the latter, which has hit a nearly four-year low — it seems that the rate landscape is less amenable in other areas.
Consumer mortgage rates climbed 13 basis points in March to 6.18%, the highest since December of last year. The 10-year Treasury, meanwhile, increased by 12 basis points to 4.25% average for the month, a figure not seen since August 2025. However, an incredibly positive sign was that spreads between the 10 year Treasury and national average DSCR rates compressed to 269 bps, the narrowest they’ve been in the past 12-month period. This is a sign that investors continue to regard DSCR loans as a safe asset in an uncertain market.
Top-Performing States for DSCR Loans
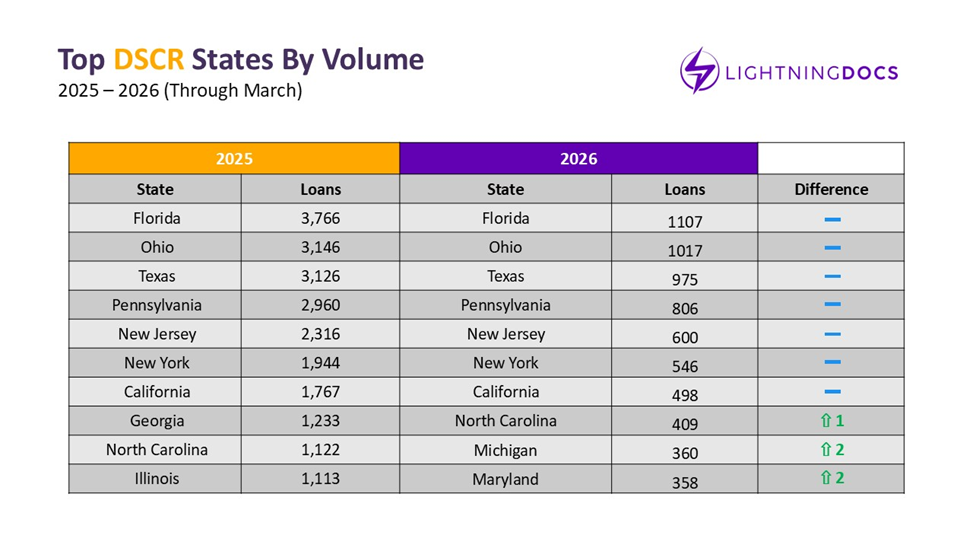
After closing out Q1, DSCR state rankings remain relatively unchanged, with the heaviest lifters maintaining high activity.
North Carolina has rejoined the top 10 after its strongest month of the year, while Maryland slips to number 11 after its weakest month of the year. Missouri is an emerging state to watch, having put up Top-10 volume in each of the last two months but has lingered in the outskirts due to a slower January.
Emerging County-Level Opportunities in DSCR Lending
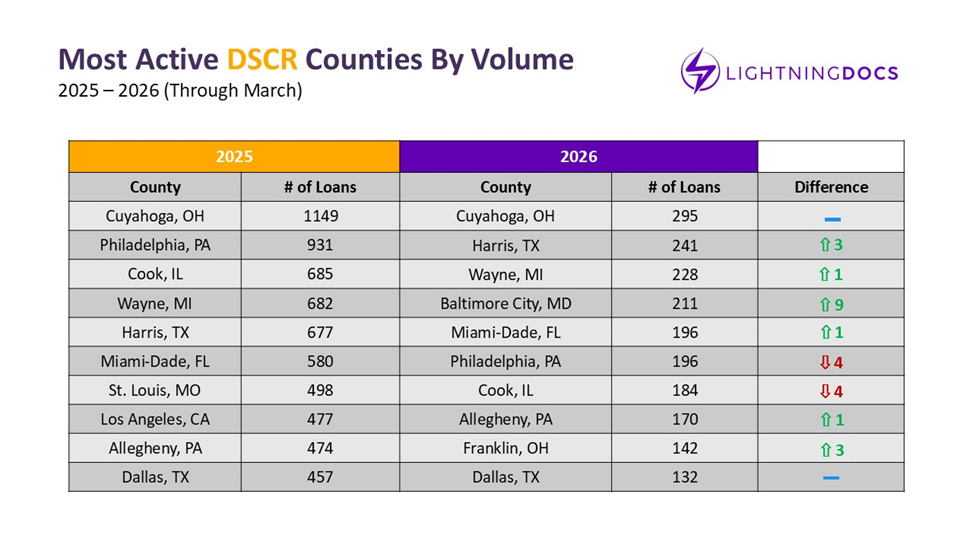
Growth in DSCR loans has contributed to significant movement in county activity nationwide — particularly in counties that weren’t highly active in previous months.
Collin, TX, home to Plano, Frisco, McKinney, and Allen, averaged two DSCR loans a month in January and February but rocketed to 33 in March. Pitt County, North Carolina (Greenville metro), saw a similar surge, increasing from just three loans across the first two months to 25 in March. Meanwhile, Cuyahoga County, Ohio (Cleveland metro), continues to lead the market, becoming the first county this year to surpass 100 monthly DSCR loans.
However, not all markets are expanding. Dallas, TX has significantly declined in volume, down by half of January’s 60 loans to 30 loans in March. A stronger first month has ensured its place in the Top 10, but sustained softness could lead to a drop in ranking in the coming months.
The Private Lending Takeaways Closing out Q1
The first quarter of 2026 highlights a private lending market that is both resilient and expanding, with record loan volumes across bridge and DSCR products. While DSCR continues to drive growth, supported by more favorable interest rates, bridge lending is showing tentative signs of slow recovery after last year’s volatility. At the same time, narrowing interest rate spreads demonstrate continued secondary market appetite for these loan products.
For private lenders, success in the coming quarter will depend on balancing growth with discipline. Leaning into DSCR demand, maintaining strong underwriting standards, and closely tracking emerging geographic opportunities will be key. As rate trends begin to level off and loan sizes remain volatile, lenders who stay agile in pricing and deal structuring will be best positioned to capture opportunity while managing risk.
For a closer look into where markets are making the biggest strides, contact us for a copy of the full Q1 market report, which includes more granular state-by-state and county-by-county data.